Every year, the IRS adjusts contribution limits for retirement savings accounts to keep pace with inflation. For 2026, those adjustments are meaningful across nearly every account type — good news for anyone working to build their financial future.
But the more important story is not the numbers themselves. It is understanding which accounts are available to you, how each one is taxed, and how to stack them intelligently based on your income, your employment situation, and how close you are to retirement.
This article is designed to serve as a practical reference. In the first section, we walk through the major tax-advantaged retirement accounts — who can use them, what the tax benefits are, and how the 2026 limits compare to 2025.
We also cover an important new rule under the SECURE 2.0 Act that took effect this year and affects catch-up contributions for higher earners in 401(k) plans.
In the second section, we bring these accounts to life through three case studies, each featuring a married couple at a different stage of life, earning a different level of income, but each with the same goal: to save ten percent of their gross household income for retirement.
As you will see, there is no single formula that works for everyone. But there is almost always a combination of accounts that can get you there in a way that is tax-efficient — and 2026 is a particularly good year to review your strategy.
Part I: The Accounts
401(k) Plans
Who is eligible. A 401(k) plan is sponsored by your employer, so eligibility depends on whether your workplace offers one. Most full-time employees at companies that sponsor a 401(k) can participate, typically after a short waiting period. Self-employed individuals can establish a Solo 401(k), which provides access to essentially the same contribution limits.
There is no income ceiling for participating in a 401(k), though highly compensated employees — generally defined as those earning more than $160,000 in 2026 — may face additional restrictions if the plan fails certain nondiscrimination tests.
Tax benefits. Traditional (pre-tax) 401(k) contributions reduce your taxable income in the year they are made. The money grows tax-deferred, and withdrawals in retirement are taxed as ordinary income. Roth 401(k) contributions are made with after-tax dollars, so there is no upfront deduction — but qualified withdrawals in retirement are completely tax-free. Employer matching contributions are always made on a pre-tax basis, regardless of whether you contribute to the traditional or Roth side.
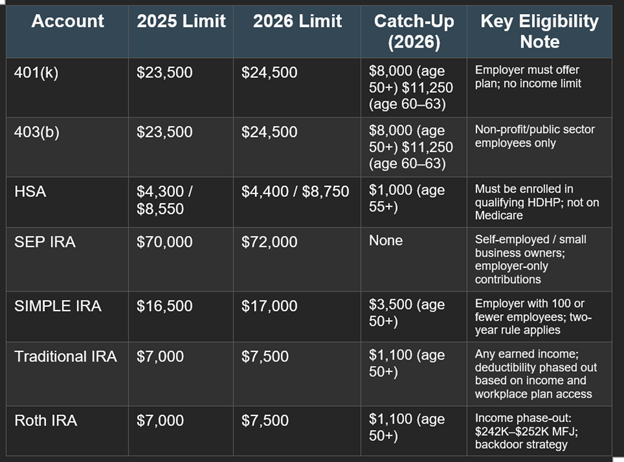
2025 vs. 2026 contribution limits. The employee deferral limit increases from $23,500 in 2025 to $24,500 in 2026. The standard catch-up contribution for those ages 50 and older increases from $7,500 to $8,000, for a total of $32,500. For those in the 60–63 age window, SECURE 2.0 introduced a “super catch-up” that remains at $11,250 in 2026, for a total employee deferral of $35,750. The overall combined limit (employee contributions plus employer contributions) increases from $70,000 to $72,000 in 2026.
2026 Rule Change — Roth Catch-Up Requirement (SECURE 2.0). This is the most significant change affecting 401(k) plans in 2026, and it deserves careful attention.
Beginning January 1, 2026, employees who are age 50 or older and whose FICA wages with their employer exceeded $150,000 in the prior calendar year must make all catch-up contributions on a Roth (after-tax) basis. Pre-tax catch-up contributions are no longer permitted for this group. This provision had been included in the SECURE 2.0 Act but was repeatedly delayed. It is now in effect.
What does this mean practically? If you are 50 or older and earned more than $150,000 in FICA wages last year, your catch-up contributions this year will be directed into the Roth side of your 401(k) — with no upfront tax deduction, but with tax-free growth and tax-free withdrawals in retirement. The dollars still count toward your catch-up limit; only the tax treatment changes.
There is an important administrative wrinkle: if your plan does not offer a Roth option, it may not be able to accept catch-up contributions from affected employees at all. If you are in this group, we recommend verifying with your HR department or plan administrator right away.
403(b) Plans
Who is eligible. A 403(b) plan is the non-profit sector’s counterpart to the 401(k). Employees of public schools, colleges and universities, hospitals, churches, and qualifying non-profit organizations are eligible. Private-sector employees are not.
Tax benefits. The structure is identical to the 401(k): traditional (pre-tax) contributions reduce current taxable income, while Roth contributions grow and are withdrawn tax-free. The same 2026 Roth catch-up rule under SECURE 2.0 applies to 403(b) plans.
2025 vs. 2026 contribution limits. The 403(b) limits are the same as the 401(k): $24,500 employee deferral, $8,000 catch-up (age 50+), and $11,250 super catch-up (ages 60–63), up from $23,500 and $7,500 respectively in 2025.
Health Savings Accounts (HSAs)
Who is eligible. To contribute to an HSA, you must be enrolled in a qualifying High-Deductible Health Plan (HDHP), must not be enrolled in Medicare, and cannot be claimed as a dependent on someone else’s tax return. If you are covered by any other non-HDHP health plan, you are also ineligible. HSAs are not limited to employees — self-employed individuals on a qualifying HDHP can contribute as well.
Tax benefits. The HSA is unique among savings vehicles in offering what is often called the “triple tax advantage.” Contributions are made on a pre-tax basis (or are tax-deductible if made directly, outside of payroll). The funds grow completely tax-free. And withdrawals for qualified medical expenses are tax-free as well. No other account in the tax code offers all three of these benefits simultaneously.
There is a fourth benefit that is often overlooked: unlike a Flexible Spending Account (FSA), HSA funds roll over indefinitely. There is no “use it or lose it” rule. A family that contributes consistently to an HSA and pays current medical expenses out of pocket can build a substantial tax-free reservoir for future healthcare costs — which, in retirement, are typically one of the largest expenses families face.
After age 65, HSA funds can be withdrawn for any purpose and are taxed as ordinary income, much like a traditional IRA. Beyond age 65, the account can also be viewed as a second IRA with a prior history of tax-free contributions – though qualified medical withdrawals remain completely tax free at any age.
2025 vs. 2026 contribution limits. For self-only coverage, the limit increases from $4,300 to $4,400 in 2026. For family coverage, the limit increases from $8,550 to $8,750. The catch-up contribution for those age 55 and older (note: HSA catch-ups begin at 55, not 50) remains $1,000, for a total family contribution of $9,750 for eligible couples with at least one spouse aged 55 or older.
SEP IRAs (Simplified Employee Pension)
Who is eligible. A SEP IRA is a powerful savings tool available to the self-employed and to small business owners. Any sole proprietor, independent contractor, freelancer, or small business owner can establish a SEP IRA. Businesses of any size may also use a SEP for their employees, though in practice it is most commonly used by those who are self-employed or who own businesses with few or no other employees.
One important distinction: in a SEP IRA, only the employer contributes. An employee cannot make their own elective deferrals as they can in a 401(k).
If the business has employees, the employer must generally contribute the same percentage of compensation for all eligible employees as for themselves. From a business owner’s perspective, this makes SEPs potentially expensive and increasingly unattractive as a business grows.
Larger businesses generally prefer 401(k) plans, which offer more flexibility – like letting employees fund their own accounts, having vesting schedules, and allowing employer matches at lower required levels.
Tax benefits. Employer contributions to a SEP IRA are fully tax-deductible. Growth inside the account is tax-deferred, and withdrawals in retirement are taxed as ordinary income. There is no Roth option for a SEP IRA.
One particularly useful feature of the SEP IRA is its flexible timing: contributions for a given tax year can be made all the way up to the tax filing deadline, including extensions. This makes the SEP IRA an excellent planning tool — a self-employed person can wait until after year-end, see what their income was, and then decide how much to contribute before filing.
2025 vs. 2026 contribution limits. The SEP IRA limit is the lesser of $72,000 or 25% of compensation in 2026, up from $70,000 in 2025. For self-employed individuals, the calculation is slightly different: the effective contribution rate is approximately 20% of net self-employment income after the self-employment tax deduction. Catch-up contributions are not permitted in a SEP IRA.
SIMPLE IRAs
Who is eligible. SIMPLE IRAs are designed for small businesses — generally those with 100 or fewer employees who earned at least $5,000 during the prior year. Both employees and the self-employed may participate. Employers who establish a SIMPLE IRA generally cannot maintain another employer-sponsored retirement plan simultaneously.
Unlike the SEP IRA, the SIMPLE IRA allows employee contributions, making it more similar in spirit to a 401(k). Employers are required to make either a dollar-for-dollar match of up to 3% of compensation, or a flat 2% non-elective contribution for all eligible employees.
One important restriction: funds withdrawn from a SIMPLE IRA within the first two years of participation are subject to a 25% penalty (rather than the standard 10%) if taken before age 59½. Participants should be aware of this two-year rule before rolling funds out of a SIMPLE IRA.
Tax benefits. Employee contributions are pre-tax and reduce current taxable income. Growth is tax-deferred, and withdrawals in retirement are taxed as ordinary income. A Roth SIMPLE option does exist under SECURE 2.0 but has not yet been widely implemented by plan providers.
2025 vs. 2026 contribution limits. The standard employee contribution limit increases from $16,500 to $17,000 in 2026. The catch-up contribution for those age 50 and older is $4,000 (increased from $3,500 in 2025). And those ages 60 – 63 can contribute $5,250 as a “super catch up” contribution.
Employers that meet certain criteria may be eligible for the higher-limit SIMPLE IRA, which increases from $17,600 to $18,100. The catch-up contribution for those age 50 and older in the higher-limit SIMPLE plans is $3,850 (unchanged from 2025).
Traditional IRAs
Who is eligible. Anyone with earned income — or a spouse with earned income — can contribute to a traditional IRA. There is no income ceiling for contributing, but the deductibility of those contributions is phased out based on income and access to a workplace retirement plan.
For 2026, the phase-out ranges for deductibility are as follows:
- Single filer covered by a workplace plan: phase-out from $81,000 to $91,000 (up from $79,000–$89,000 in 2025)
- Married filing jointly, contributor covered: phase-out from $129,000 to $149,000 (up from $126,000–$146,000 in 2025)
- Married filing jointly, spouse covered but not contributor: phase-out from $242,000 to $252,000 (up from $236,000–$246,000 in 2025)
- No workplace plan coverage: contributions are fully deductible regardless of income
Tax benefits. If your contribution is deductible, it reduces your taxable income in the year it is made. Growth is tax-deferred, and withdrawals in retirement are taxed as ordinary income. Required Minimum Distributions (RMDs) begin at age 73 for those born prior to 1960, and at age 75 for those born in 1960 and later.
2025 vs. 2026 contribution limits. The contribution limit increases from $7,000 to $7,500 in 2026. The catch-up contribution for those age 50 and older increases from $1,000 to $1,100 — the first increase to the IRA catch-up since 2006.
SECURE 2.0 indexed this amount to inflation for the first time, and 2026 marks the first year the adjustment has been triggered. Total maximum IRA contribution for those 50 and older: $8,600 in 2026. Note that this limit is combined across all personal IRAs — traditional and Roth together.
Roth IRAs
Who is eligible. Eligibility to contribute directly to a Roth IRA is subject to income limits. For 2026, the ability to contribute begins to phase out at:
- Single filers: $153,000, and is eliminated at $168,000 (up from $150,000–$165,000 in 2025)
- Married filing jointly: $242,000, and is eliminated at $252,000 (up from $236,000–$246,000 in 2025)
High earners who exceed these thresholds are not permitted to make direct Roth IRA contributions. However, there is no income limit on Roth conversions — and the so-called “backdoor Roth” strategy, which involves making a non-deductible traditional IRA contribution and then immediately converting it to a Roth IRA, remains available. This strategy works most cleanly when you do not have significant pre-tax IRA balances elsewhere (due to the “pro-rata rule” that applies to conversions).
Tax benefits. Roth IRA contributions are made with after-tax dollars, so there is no upfront deduction. The benefit comes on the back end: qualified withdrawals in retirement are entirely tax-free, including all investment growth. The Roth IRA is also not subject to Required Minimum Distributions during the account owner’s lifetime, which gives it significant advantages both for tax planning in retirement and for legacy purposes.
Importantly, Roth IRA contributions (not earnings) can be withdrawn at any time, for any reason, without taxes or penalties — providing a degree of flexibility that other retirement accounts do not.
2025 vs. 2026 contribution limits. The same increases apply as with the traditional IRA: $7,500 in 2026 (up from $7,000 in 2025), with a catch-up of $1,100 (up from $1,000). Again, this limit is shared across all personal IRAs combined.
2026 Contribution Limits at a Glance