
September delivered another month of positive returns for investors:
- Russell 2000 Index of small company stocks returned 5.5%
- MSCI EAFE Index of foreign stocks returned 4.8%
- S&P 500 Index of large company US stocks returned 4.2%
- Bloomberg Aggregate Bond Index, the benchmark for US bonds, rose by 1.3%
US stocks reached new highs eight more times in September, bringing the tally in 2025 to twenty-eight new “all-time highs” for large company US stocks.
When viewed through a broader lens of the quarter (last three months):
- US small company stocks were the top performer, returning 10.5%
- US large company stock returns of 7.3% edged out foreign stock returns of 6.2%
- Bonds delivered a more muted return of 2.8%
Widening the aperture further still, the chart below shows US financial market returns by quarter for the last two years.
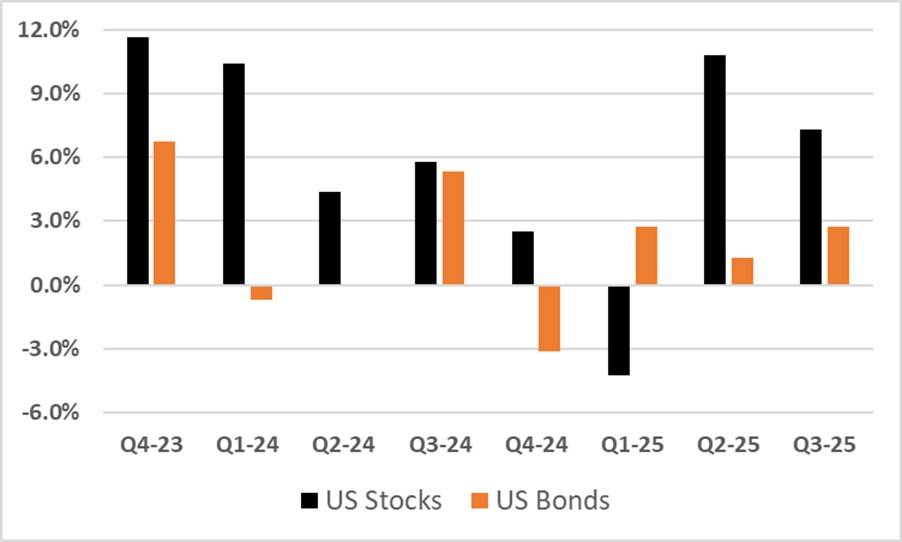
Source: MFA & Morningstar
Large company US stock returns are shown in black, US bond returns are shown in orange.
This picture illustrates a pleasing run of positive performance: only one quarter in the past eight has been negative for stocks, with quarterly average stock performance at 6%.
Bonds haven’t fared as well, but still the outcome still has been constructive for investors. With two quarters of negative returns and one of essentially zero return, quarterly bond performance has averaged 2%.
One of the questions at the front of mind for many investors is: will the positive trends persist?
Here’s some historical perspective: according to research from Jessica Rabe at DataTrek (an independent research firm), the odds are greater for returns to reach their high point for the year in the 4th quarter when the stock market is having a good year.
DataTrek looked at annual returns each year since 1980 and catalogued the month in which the stock market peaked each year.
The table below shows stock market peaks by month; percent of time since 1980 that the stock market peaked for the year in that month; and average annual return when stock market peaked in a given month.
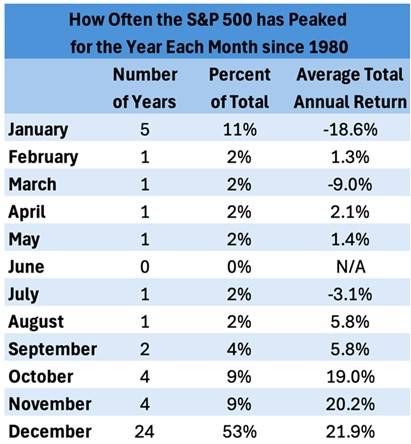
Source: DataTrek
Here are two key take-aways from DataTrek’s research:
- the S&P 500 has tended to reach its high point for the year in December when returns for the full year were strongly positive (this happened in 24 of the 45 years since 1980, or 53% of the time – bottom of the chart)
- the stock market has tended to reach its high point for the year in January when returns for the full year were strongly negative (5 times in 45 years, or 11% of the time – bottom of the chart)
As of Friday, October 3, US stocks had returned 15% year-to-date.
Applying her research to today’s market environment, Rabe at DataTrek concludes: “based on historical seasonal returns over the last 45 years, the S&P has significantly higher odds of peaking in the final quarter of this year rather than in September.”
It’s important to recognize that past performance doesn’t guarantee future results. But we can use history as a guide and as a way of informing our thinking about how things may unfold in the future.
While we avoid using terms such as “with certainty” and “without doubt”, the current environment of economic expansion, strong company earnings, and a Federal Reserve predisposed to bring down short-term interest rates seems conducive to a continuation of positive financial market trends, both for stocks and bonds.
That said, one area of emerging weakness which we’re watching closely is the US labor market.
The chart below from JP Morgan Asset Management presents monthly jobs gains using data from the Bureau of Labor Statistics. It shows that job growth slowed meaningfully over the summer of 2025.
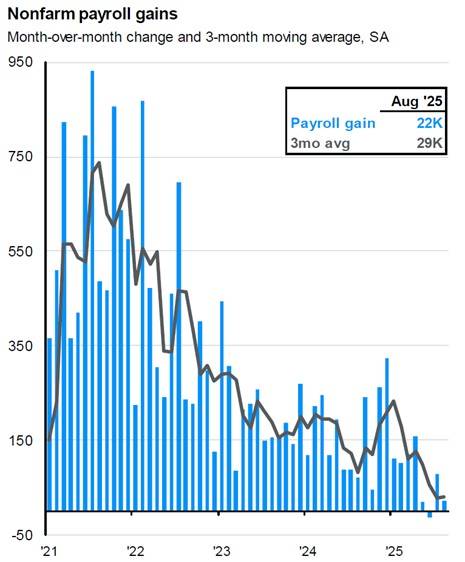
Source: JP Morgan Asset Management.
Monthly jobs gains had been inflated because of “pandemic catch up” in 2021 and 2022 but still averaged over 200,000 jobs per month in the last couple of years through spring 2025.
This trend moved down to an average of 29,000 new jobs per month this summer.
If the employment situation downshifts further into persistent net job losses (yet to be determined) this could put downward pressure on US economic growth and put the stock market “good times” at risk.
And a new source of uncertainly stems from the shutdown of the US federal government. More information on that situation in next week’s upcoming blog “Government Shutdown Briefing”.
-RK