

The current bull market in stocks will turn four years old in mid-October.
But the most recent stretch turned from a bull charge in the second quarter of 2026 to a trot in Q3. And September was a plod.
Bull Market Roundup
- Stock market returns (as measured by the S&P 500 Index of large company U.S. stocks) in the three years following the 2022 bear market were extraordinary: 2023: 26%, 2024: 25%, and 2025: 18%
- Each of these years was well above the long run annual average return for U.S. stocks of 10%
- After a pause during the first quarter of 2026, the bull continued to run: the S&P 500 charged ahead by nearly 15% in the April – June period
- The pace of U.S. large cap stock returns slowed to a modest 2% gain in Q3
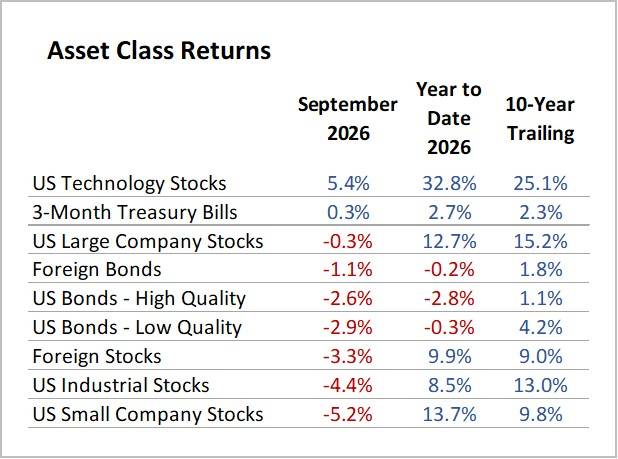
- In September, positive momentum stalled: while tech stocks pushed higher by 5.4%, most other areas of the market declined – see the details in the chart below
Here are results for September and 2026 Year-to-Date, compared to longer-term annualized returns (10-Year Trailing):
Source: Morningstar
A few of the bigger questions on investors’ minds as we enter the final quarter of 2026 seem to be: What’s worrying the bull? Can the bull keep running in Q4 and beyond? What should investors do now?
The Bull’s Worries
Three issues worrying the bull and raising concerns for investors are:
- Oil Prices & Interest Rates: While these are separate items, they are linked. Oil prices have climbed about 50% since the start of the Iran war. Higher oil prices translated directly and immediately to higher prices at the pump for consumers. And when oil stays elevated, the inflation effect broadens out. For example, think about the inflationary impact that higher fertilizer costs have on producing food; or that higher transportation costs (due to elevated diesel prices) have on getting goods to market. Elevated prices triggered the Federal Reserve to act in mid-September. The Fed raised short-term interest rates, and long-term interest rates climbed, too. Higher interest rates mean an increased cost of financing, putting pressure on businesses and consumers alike. Lower profit margins are a headwind for stock prices, and household budget pressures mean potentially less is available for retirement savings and investment. Reduced tension in the Middle East likely would begin to reverse the negative dynamic of elevated energy prices and higher interest rates. Absent progress toward peace, pressure on stocks can persist.
- Midterm Elections: In just under a month, the U.S. will hold midterm elections. The midterm year is usually the weakest for the stock market of the four-year presidential cycle. And the stock market swings are typically bigger in midterm years. On average, stocks sink 19% from peak to trough during a midterm year, compared to about 15% on average in non-midterm years. Interestingly, October and November of midterm years have averaged gains of about 3% and 2.7% since 1950. A plausible explanation is that uncertainty drops once the results are known.
- Bad Market Breadth: September’s stock price moves show that market returns have narrowed to a relatively small subset of stocks. Last month, almost 80% of stocks in the S&P 500 were down; the average stock was off 5%; and only 2 out of 11 sectors were up, led by technology. Some market commentators call this narrowing of market performance “bad breadth”. Technical analysis Jonathan Krinsky of BTIG, a brokerage firm, was quoted in a recent MarketWatch article, and pointed to bad breadth to support his claim that “the clock is ticking, and we see a sell-off coming sooner than later.”
These issues highlighted above can, and often do, act as a drag on stock prices in the near-term.
But investors should keep these negative influences in perspective.
The direction and rate of change of the U.S. economy tends to have a greater impact on financial markets over the longer term.
The Bull’s Legs
Whether you love it, hate it, or fall somewhere in between, Artificial Intelligence (AI) is giving the stock bull market its legs.
Many of today’s stock market stars are AI-focused companies, because AI usage is increasing rapidly and investors are quite enthusiastic about their future prospects.
But the build-out of AI infrastructure is boosting demand for products and services of all sorts of companies – such as construction firms, industrial manufacturers, power producers, and electric utilities – and is therefore having a much broader impact on the corporate sector and the U.S. economy.
In a recent research note, Capital Group, a California-based fund manager, points out that “the sheer scale of AI-related spending is nothing like we’ve seen before.”
Much of the capital expenditures – an estimated $800 billion in 2026 – are going toward the construction of massive AI data centers and related projects across the U.S. And the spending is expected to accelerate in 2027.
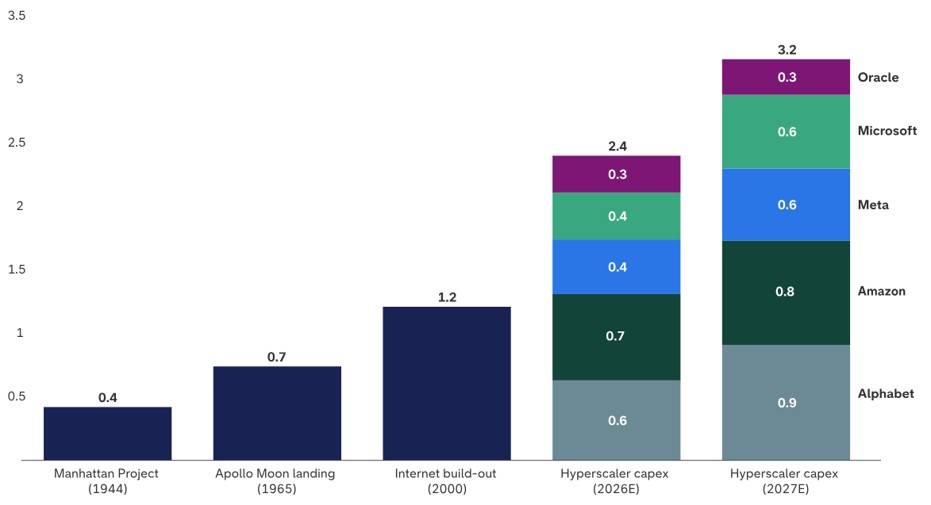
The companies leading the spending charge are well-known technology firms often referred to as “Hyperscalers”: Alphabet, Amazon, Meta Platforms, Microsoft, and Oracle.
The chart below, courtesy of Capital Group, indicates that AI capital expenditure in 2026 will equal 2.4% of U.S. Gross Domestic Product (GDP) in 2026, and rise to 3.2% in 2027.
Source: Capital Group
This type of spending dwarfs other large, concentrated capital expenditure episodes in history, such as the build out of the internet in 2000 (1.2% of GDP); the Apollo Moon landing in 1965 (0.7% of GDP); and the Manhattan Project in 1944 (0.4% of GDP).
While beyond the scope of this chart, capital expenditure during the railroad buildout in the 1800s was of a similar magnitude as today’s AI activity.
AI spending feeds directly into economic growth. Real U.S. economy is expected to expand by 2.5. – 3.0% (after inflation is considered) in both 2026 and 2027.
Mark Zandi, the chief economist at Moody’s Analytics, estimates that about 30% of the economy’s inflation-adjusted growth this year will come from the AI boom, directly or indirectly (cited in a recent New York Times article).
While stock market selloffs can happen at any time, it would be highly unusual to see an extended stock market downturn or bear market during a time of such strong economic growth.
No Bull: What Investors Should Do
Risk, volatility, and uncertainty often create unease. Discomfort is the price we pay as investors to earn returns that support our financial plans.
The psychological tendency that drives us to do something – even when avoiding action is likely to result in a better outcome – is known as action bias.
Typically, the best course of action is to stay the course, even when the bull market takes a break.
Continuing to make regular contributions to savings and retirement accounts (especially when markets decline), and rebalancing when portfolios get out of line with long-term asset allocation targets, are two of the best moves investors can make.
Beyond this, it can be helpful to meditate on the behavioral mantra that Jack Bogle, the founder of Vanguard, used to implore, especially when investors feel a strong urge to take action in a portfolio because of a perceived negative development (such as, when stocks sell off): “Don’t just do something, sit there!”