
During the summer of 2025, financial markets have been somnolent – so far.
In a typical month which has 21 trading days, the S&P 500 index of large company stocks registers a daily rise or fall that exceeds 1% on average four times (trading days).
This means that about 80% of the time, stock market movements are unremarkable.
Since the summer solstice through the end of July, there were only two days when stocks moved more than 1% – and both were in a positive direction.
In this period of calm, stocks have been trending up, and the S&P 500 reached a new all-time high on July 28.
Recently, stock prices have been supported by company earnings reports for the 2nd quarter of 2025, which have validated that corporate revenues and profitability are generally strong, and in many cases have exceeded Wall Street’s earnings estimates.
Somnolence “took a break” on August 1st, however, when the Bureau of Labor Statistics (BLS) released its monthly employment report showing significant weakness in the labor market – and stocks proceeded to drop by 1.5%.
Specifically, downward revisions to May and June showed that 253,000 fewer jobs were created in these two months than previously reported.
In July, a net 73,000 new jobs were added – well below a level of 100,000 or more new jobs added per month that is commonly viewed as a sign of a healthy, growing economy.
The BLS employment report followed an announcement on July 30 which showed that the overall rate of growth of the US economy had slowed during the first half of 2025.
The Commerce Department said the value of all goods and services produced across the economy, or gross domestic product (GDP) grew at an average annual rate of 1.2% in the first six months of this year, a step down from the 2.5% average pace in 2024.
The weaker labor market, and slower pace of economic activity, may be enough to convince the Federal Reserve to change its policy and reduce its target for short-term interest rates – commonly referred to as a “rate cutting cycle” – as we approach autumn and head into winter.
So, recent data releases and stock price movements seem to indicate that both the US economy and the financial markets are at an inflection point.
If the current economic expansion holds up, and if the Federal Reserve begins to reduce interest rates soon, the stock bull market could continue to charge forward.
But if consumer spending sours, if businesses retrench, and if the economy goes from expansion to contraction, it could mean tougher times for stocks – even if the Federal Reserve cuts interest rates.
JP Morgan Asset Management researchers looked at the relationship between Federal Reserve interest rate policy changes and stock market performance against the backdrop of economic expansions and recessions going back 40 years.
The research shows:
- Stocks have done well when Fed rate cutting cycles have coincided with slower (but still positive) economic growth – large company US stocks climbed on average by 18% in the year following the first Fed interest rate cut of a new cycle
- When rate cuts coincide with recessions, stocks have suffered – losing an average of 5% in the year following the first interest rate cut of a new cycle
The key takeaway: consumer and business activity, along with the direction of Fed interest rate policy, will strongly influence the path along which financial markets will travel in the months ahead.
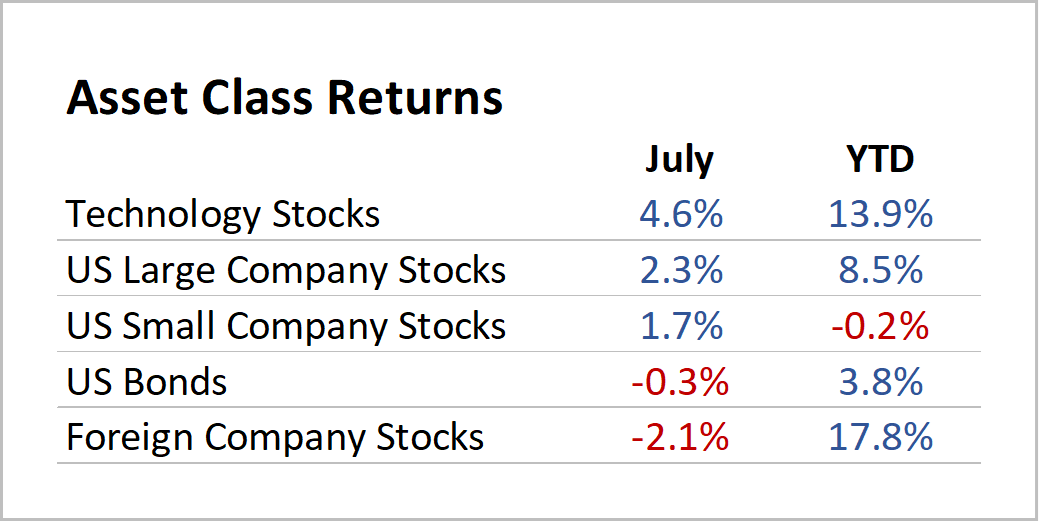
For the month of July, US stocks delivered satisfactory returns. Technology stocks did particularly well, gaining 4.6% for the month.
Tech stock strength helped to boost US large company stock returns, which gained 2.3% for the month. Small company US stocks rose by 1.7%.
The US bond index return was slightly negative last month as longer-term bond yields edged up.
And some of the steam was taken out of foreign company stocks, which declined by 2.1% in dollar terms, due primarily to a stronger US dollar.
The US dollar snapped its 5-month losing streak versus major developed economy currencies and rose by an average of 3% in July.
The chart below shows financial market performance for the month of July and Year-to-Date (YTD).
Source: Moore Financial Advisors & Morningstar
-RK