Category

Investment Strategy

Guide to Retirement Accounts in 2026

Every year, the IRS adjusts contribution limits for retirement savings accounts to keep pace with inflation. For 2026, those adjustments are meaningful across nearly every account type — good news for anyone working to build their financial future.

But the more important story is not the numbers themselves. It is understanding which accounts are available to you, how each one is taxed, and how to stack them intelligently based on your income, your employment situation, and how close you are to retirement.

This article is designed to serve as a practical reference. In the first section, we walk through the major tax-advantaged retirement accounts — who can use them, what the tax benefits are, and how the 2026 limits compare to 2025.

We also cover an important new rule under the SECURE 2.0 Act that took effect this year and affects catch-up contributions for higher earners in 401(k) plans.

In the second section, we bring these accounts to life through three case studies, each featuring a married couple at a different stage of life, earning a different level of income, but each with the same goal: to save ten percent of their gross household income for retirement.

As you will see, there is no single formula that works for everyone. But there is almost always a combination of accounts that can get you there in a way that is tax-efficient — and 2026 is a particularly good year to review your strategy.

Part I: The Accounts

401(k) Plans

Who is eligible. A 401(k) plan is sponsored by your employer, so eligibility depends on whether your workplace offers one. Most full-time employees at companies that sponsor a 401(k) can participate, typically after a short waiting period. Self-employed individuals can establish a Solo 401(k), which provides access to essentially the same contribution limits.

There is no income ceiling for participating in a 401(k), though highly compensated employees — generally defined as those earning more than $160,000 in 2026 — may face additional restrictions if the plan fails certain nondiscrimination tests.

Tax benefits. Traditional (pre-tax) 401(k) contributions reduce your taxable income in the year they are made. The money grows tax-deferred, and withdrawals in retirement are taxed as ordinary income. Roth 401(k) contributions are made with after-tax dollars, so there is no upfront deduction — but qualified withdrawals in retirement are completely tax-free. Employer matching contributions are always made on a pre-tax basis, regardless of whether you contribute to the traditional or Roth side.

2025 vs. 2026 contribution limits. The employee deferral limit increases from $23,500 in 2025 to $24,500 in 2026. The standard catch-up contribution for those ages 50 and older increases from $7,500 to $8,000, for a total of $32,500. For those in the 60–63 age window, SECURE 2.0 introduced a “super catch-up” that remains at $11,250 in 2026, for a total employee deferral of $35,750. The overall combined limit (employee contributions plus employer contributions) increases from $70,000 to $72,000 in 2026.

2026 Rule Change — Roth Catch-Up Requirement (SECURE 2.0). This is the most significant change affecting 401(k) plans in 2026, and it deserves careful attention.

Beginning January 1, 2026, employees who are age 50 or older and whose FICA wages with their employer exceeded $150,000 in the prior calendar year must make all catch-up contributions on a Roth (after-tax) basis. Pre-tax catch-up contributions are no longer permitted for this group. This provision had been included in the SECURE 2.0 Act but was repeatedly delayed. It is now in effect.

What does this mean practically? If you are 50 or older and earned more than $150,000 in FICA wages last year, your catch-up contributions this year will be directed into the Roth side of your 401(k) — with no upfront tax deduction, but with tax-free growth and tax-free withdrawals in retirement. The dollars still count toward your catch-up limit; only the tax treatment changes.

There is an important administrative wrinkle: if your plan does not offer a Roth option, it may not be able to accept catch-up contributions from affected employees at all. If you are in this group, we recommend verifying with your HR department or plan administrator right away.

403(b) Plans

Who is eligible. A 403(b) plan is the non-profit sector’s counterpart to the 401(k). Employees of public schools, colleges and universities, hospitals, churches, and qualifying non-profit organizations are eligible. Private-sector employees are not.

Tax benefits. The structure is identical to the 401(k): traditional (pre-tax) contributions reduce current taxable income, while Roth contributions grow and are withdrawn tax-free. The same 2026 Roth catch-up rule under SECURE 2.0 applies to 403(b) plans.

2025 vs. 2026 contribution limits. The 403(b) limits are the same as the 401(k): $24,500 employee deferral, $8,000 catch-up (age 50+), and $11,250 super catch-up (ages 60–63), up from $23,500 and $7,500 respectively in 2025.

Health Savings Accounts (HSAs)

Who is eligible. To contribute to an HSA, you must be enrolled in a qualifying High-Deductible Health Plan (HDHP), must not be enrolled in Medicare, and cannot be claimed as a dependent on someone else’s tax return. If you are covered by any other non-HDHP health plan, you are also ineligible. HSAs are not limited to employees — self-employed individuals on a qualifying HDHP can contribute as well.

Tax benefits. The HSA is unique among savings vehicles in offering what is often called the “triple tax advantage.” Contributions are made on a pre-tax basis (or are tax-deductible if made directly, outside of payroll). The funds grow completely tax-free. And withdrawals for qualified medical expenses are tax-free as well. No other account in the tax code offers all three of these benefits simultaneously.

There is a fourth benefit that is often overlooked: unlike a Flexible Spending Account (FSA), HSA funds roll over indefinitely. There is no “use it or lose it” rule. A family that contributes consistently to an HSA and pays current medical expenses out of pocket can build a substantial tax-free reservoir for future healthcare costs — which, in retirement, are typically one of the largest expenses families face.

After age 65, HSA funds can be withdrawn for any purpose and are taxed as ordinary income, much like a traditional IRA. Beyond age 65, the account can also be viewed as a second IRA with a prior history of tax-free contributions – though qualified medical withdrawals remain completely tax free at any age.

2025 vs. 2026 contribution limits. For self-only coverage, the limit increases from $4,300 to $4,400 in 2026. For family coverage, the limit increases from $8,550 to $8,750. The catch-up contribution for those age 55 and older (note: HSA catch-ups begin at 55, not 50) remains $1,000, for a total family contribution of $9,750 for eligible couples with at least one spouse aged 55 or older.

SEP IRAs (Simplified Employee Pension)

Who is eligible. A SEP IRA is a powerful savings tool available to the self-employed and to small business owners. Any sole proprietor, independent contractor, freelancer, or small business owner can establish a SEP IRA. Businesses of any size may also use a SEP for their employees, though in practice it is most commonly used by those who are self-employed or who own businesses with few or no other employees.

One important distinction: in a SEP IRA, only the employer contributes. An employee cannot make their own elective deferrals as they can in a 401(k).

If the business has employees, the employer must generally contribute the same percentage of compensation for all eligible employees as for themselves. From a business owner’s perspective, this makes SEPs potentially expensive and increasingly unattractive as a business grows.

Larger businesses generally prefer 401(k) plans, which offer more flexibility – like letting employees fund their own accounts, having vesting schedules, and allowing employer matches at lower required levels.

Tax benefits. Employer contributions to a SEP IRA are fully tax-deductible. Growth inside the account is tax-deferred, and withdrawals in retirement are taxed as ordinary income. There is no Roth option for a SEP IRA.

One particularly useful feature of the SEP IRA is its flexible timing: contributions for a given tax year can be made all the way up to the tax filing deadline, including extensions. This makes the SEP IRA an excellent planning tool — a self-employed person can wait until after year-end, see what their income was, and then decide how much to contribute before filing.

2025 vs. 2026 contribution limits. The SEP IRA limit is the lesser of $72,000 or 25% of compensation in 2026, up from $70,000 in 2025. For self-employed individuals, the calculation is slightly different: the effective contribution rate is approximately 20% of net self-employment income after the self-employment tax deduction. Catch-up contributions are not permitted in a SEP IRA.

SIMPLE IRAs

Who is eligible. SIMPLE IRAs are designed for small businesses — generally those with 100 or fewer employees who earned at least $5,000 during the prior year. Both employees and the self-employed may participate. Employers who establish a SIMPLE IRA generally cannot maintain another employer-sponsored retirement plan simultaneously.

Unlike the SEP IRA, the SIMPLE IRA allows employee contributions, making it more similar in spirit to a 401(k). Employers are required to make either a dollar-for-dollar match of up to 3% of compensation, or a flat 2% non-elective contribution for all eligible employees.

One important restriction: funds withdrawn from a SIMPLE IRA within the first two years of participation are subject to a 25% penalty (rather than the standard 10%) if taken before age 59½. Participants should be aware of this two-year rule before rolling funds out of a SIMPLE IRA.

Tax benefits. Employee contributions are pre-tax and reduce current taxable income. Growth is tax-deferred, and withdrawals in retirement are taxed as ordinary income. A Roth SIMPLE option does exist under SECURE 2.0 but has not yet been widely implemented by plan providers.

2025 vs. 2026 contribution limits. The standard employee contribution limit increases from $16,500 to $17,000 in 2026. The catch-up contribution for those age 50 and older is $4,000 (increased from $3,500 in 2025). And those ages 60 – 63 can contribute $5,250 as a “super catch up” contribution.

Employers that meet certain criteria may be eligible for the higher-limit SIMPLE IRA, which increases from $17,600 to $18,100. The catch-up contribution for those age 50 and older in the higher-limit SIMPLE plans is $3,850 (unchanged from 2025).

Traditional IRAs

Who is eligible. Anyone with earned income — or a spouse with earned income — can contribute to a traditional IRA. There is no income ceiling for contributing, but the deductibility of those contributions is phased out based on income and access to a workplace retirement plan.

For 2026, the phase-out ranges for deductibility are as follows:

  • Single filer covered by a workplace plan: phase-out from $81,000 to $91,000 (up from $79,000–$89,000 in 2025)
  • Married filing jointly, contributor covered: phase-out from $129,000 to $149,000 (up from $126,000–$146,000 in 2025)
  • Married filing jointly, spouse covered but not contributor: phase-out from $242,000 to $252,000 (up from $236,000–$246,000 in 2025)
  • No workplace plan coverage: contributions are fully deductible regardless of income

Tax benefits. If your contribution is deductible, it reduces your taxable income in the year it is made. Growth is tax-deferred, and withdrawals in retirement are taxed as ordinary income. Required Minimum Distributions (RMDs) begin at age 73 for those born prior to 1960, and at age 75 for those born in 1960 and later.

2025 vs. 2026 contribution limits. The contribution limit increases from $7,000 to $7,500 in 2026. The catch-up contribution for those age 50 and older increases from $1,000 to $1,100 — the first increase to the IRA catch-up since 2006.

SECURE 2.0 indexed this amount to inflation for the first time, and 2026 marks the first year the adjustment has been triggered. Total maximum IRA contribution for those 50 and older: $8,600 in 2026. Note that this limit is combined across all personal IRAs — traditional and Roth together.

Roth IRAs

Who is eligible. Eligibility to contribute directly to a Roth IRA is subject to income limits. For 2026, the ability to contribute begins to phase out at:

  • Single filers: $153,000, and is eliminated at $168,000 (up from $150,000–$165,000 in 2025)
  • Married filing jointly: $242,000, and is eliminated at $252,000 (up from $236,000–$246,000 in 2025)

High earners who exceed these thresholds are not permitted to make direct Roth IRA contributions. However, there is no income limit on Roth conversions — and the so-called “backdoor Roth” strategy, which involves making a non-deductible traditional IRA contribution and then immediately converting it to a Roth IRA, remains available. This strategy works most cleanly when you do not have significant pre-tax IRA balances elsewhere (due to the “pro-rata rule” that applies to conversions).

Tax benefits. Roth IRA contributions are made with after-tax dollars, so there is no upfront deduction. The benefit comes on the back end: qualified withdrawals in retirement are entirely tax-free, including all investment growth. The Roth IRA is also not subject to Required Minimum Distributions during the account owner’s lifetime, which gives it significant advantages both for tax planning in retirement and for legacy purposes.

Importantly, Roth IRA contributions (not earnings) can be withdrawn at any time, for any reason, without taxes or penalties — providing a degree of flexibility that other retirement accounts do not.

2025 vs. 2026 contribution limits. The same increases apply as with the traditional IRA: $7,500 in 2026 (up from $7,000 in 2025), with a catch-up of $1,100 (up from $1,000). Again, this limit is shared across all personal IRAs combined.

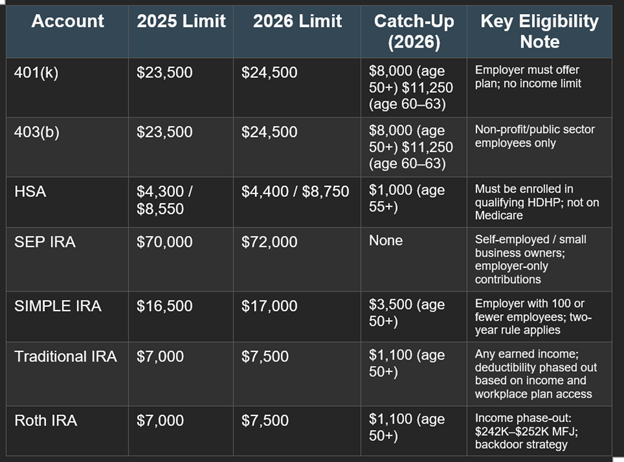
2026 Contribution Limits at a Glance

Note: 401(k) and 403(b) catch-up contributions for employees age 50+ earning more than $150,000 in FICA wages in prior year must be made as Roth (after-tax) beginning in 2026 under SECURE 2.0. Source: Moore Financial Advisors

Part II: Putting It Together — Three Case Studies

The accounts described in Part I are most useful when you can see how they work together for a real family.

The three scenarios below all share a common profile: the couple is married and filing jointly. Spouse 1 works for a company that offers both a 401(k) plan and an HSA-eligible High-Deductible Health Plan. Spouse 2 earns income as an independent contractor. And in each case, the couple is targeting retirement savings equal to 10% of their gross household income.

The income level, age, and proximity to retirement vary meaningfully across the three scenarios — and so does the optimal strategy.

Scenario 1: Building the Foundation

25 Years from Retirement • Household Income: $225,000 • Savings Target: $22,500

The income picture. Let’s assume Spouse 1 earns $150,000 in W-2 income, and Spouse 2 earns $75,000 as an independent contractor. The couple files jointly with a combined MAGI of $225,000 — which sits comfortably below the 2026 Roth IRA phase-out threshold of $242,000. That is an important and somewhat time-sensitive window: both spouses are eligible for direct Roth IRA contributions, and at age 40 they have 25 years or more for those contributions to compound entirely tax-free.

Spouse 1 — Roth 401(k) and HSA. Spouse 1 does not need to max out the 401(k) to hit the household savings target — but the type of contribution matters. Because they have 25 years until retirement and are still in a moderate tax bracket, the Roth 401(k) is the preferred vehicle: contributions are after-tax today, but every dollar of growth over the next quarter-century and into retirement will be completely tax-free at withdrawal.

The HSA deserves equal emphasis. With a 25-year time horizon, the HSA should be thought of not as a medical spending account, but as a stealth retirement account with a triple tax advantage. If the couple enrolls in a qualifying HDHP and maximizes the family HSA contribution of $8,750, and pays their current medical expenses out of pocket, those dollars can grow tax-free for decades and eventually can be used tax-free for healthcare in retirement — when medical costs tend to be at their highest.

Spouse 2 — Roth IRA. For Spouse 2, the most straightforward path is a direct Roth IRA contribution. At $225,000 combined income, they qualify. The maximum contribution in 2026 is $7,500, and like the Roth 401(k) for Spouse 1, the 25-year compounding window makes the Roth treatment highly attractive. If Spouse 2 is looking to save more, a SEP IRA offers significant additional capacity — up to approximately 20% of net self-employment income, or roughly $14,000–$15,000 in this income range.

However, SEP IRA contributions are pre-tax and add to traditional IRA balances, which creates future RMD obligations. For a 40-year-old, building Roth assets now is generally the stronger long-term choice.

Reaching the $22,500 target:

  • Spouse 1, Roth 401(k): $6,250
  • Family HSA: $8,750
  • Spouse 2, Roth IRA: $7,500
  • Total: $22,500

Key insight. This couple is in a genuinely fortunate position: high enough income to save meaningfully, but still within the Roth IRA eligibility range. As income grows over the coming years, Roth IRA access may phase out, making direct contributions unavailable. Building future tax free assets aggressively now — in the 401(k), the Roth IRA, and the HSA — is a strategy that will pay dividends for decades.

Scenario 2: The Final Push

5 Years from Retirement • Household Income: $500,000 • Savings Target: $50,000

The income picture. Let’s assume Spouse 1 earns $300,000 in W-2 income, and Spouse 2 earns $200,000 as an independent contractor. Both are in the 60–63 age window. The combined MAGI of $500,000 places them well above the Roth IRA income limit — direct Roth IRA contributions are not available. However, the heightened catch-up contribution limits available to the 60–63 age group, combined with the SEP IRA’s generous ceiling, give this couple significant tax-advantaged savings capacity.

Spouse 1 — 401(k) super catch-up and HSA. At age 62, Spouse 1 is squarely in the super catch-up window. The maximum employee deferral in 2026 is $24,500, and the super catch-up for ages 60–63 is $11,250 — for a total employee contribution of $35,750. Add the family HSA contribution of $8,750 plus the age-55+ HSA catch-up of $1,000, and Spouse 1 alone accounts for $45,500 in tax-advantaged contributions.

There is an important planning note here: because Spouse 1 earned more than $150,000 in FICA wages in the prior year, the SECURE 2.0 Roth catch-up rule applies. All catch-up contributions to the 401(k) — the full $11,250 — must be made as Roth (after-tax).

This means no immediate deduction on the catch-up amount, but those dollars will grow and be withdrawn completely tax-free. Given that this couple is likely to be in a high tax bracket throughout retirement, this is not necessarily a disadvantage — but it does affect current-year cash flow planning and should be incorporated into the tax projection for the year.

Also worth noting: with only five years remaining before retirement, HSA contributions should continue to be maximized — but the couple should be aware that HSA contributions must stop when Spouse 1 enrolls in Medicare. If retirement coincides with Medicare enrollment, the HSA contribution window closes.

Spouse 2 — SEP IRA and backdoor Roth. With $200,000 in gross self-employment income, Spouse 2’s SEP IRA capacity is substantial. After the self-employment tax deduction, net self-employment income is approximately $186,000, and 20% of that produces an allowable SEP contribution of roughly $37,000. This provides a powerful pre-tax deduction on a significant portion of Spouse 2’s self-employment income.

At this income level, a direct Roth IRA contribution is not available — but the backdoor Roth strategy may still be viable. The mechanics involve making a non-deductible $7,500 contribution to a traditional IRA and immediately converting it to a Roth IRA.

The key consideration here is the pro-rata rule: if Spouse 2 has other pre-tax IRA balances (such as from a prior rollover), the conversion will be partially taxable. If the SEP IRA holds significant pre-tax assets, the backdoor Roth becomes considerably less attractive — this is a scenario that warrants careful tax modeling before proceeding.

Reaching the $50,000 target. The remarkable thing about this scenario is that Spouse 1’s contributions alone — $45,500 — nearly cover the entire household savings target. Adding even a modest SEP IRA contribution from Spouse 2 easily surpasses $50,000.

  • Spouse 1, 401(k) base deferral: $24,500
  • Spouse 1, super catch-up (ages 60–63, Roth): $11,250
  • Family HSA (+ age-55 catch-up): $9,750
  • Spouse 2, SEP IRA: $4,500 (minimum to reach target)
  • Total: $50,000

Key insight. This couple’s actual tax-advantaged savings capacity far exceeds their 10% target. The SEP IRA alone could shelter an additional $30,000+ of self-employment income. In the five years before retirement, maximizing pre-tax deductions now — while simultaneously building Roth assets through the mandatory Roth catch-up — positions the couple with diversified tax exposure in retirement. That tax diversification, between taxable and tax-free income sources, will give them meaningful flexibility to manage their tax bracket after they stop working.

Scenario 3: Extending the Runway

Spouse 1 Retired • Spouse 2 Still Working • Household Earned Income: $75,000 • Savings Target: $7,500

The income picture. This scenario is different in kind from the first two. Spouse 1 is retired — perhaps drawing from a pension or investment portfolio — and has no earned income. Spouse 2 is still working as an independent contractor, earning $75,000. The household’s total earned income — the figure that governs retirement account eligibility and contribution limits — is Spouse 2’s $75,000 alone.

The couple’s combined MAGI is well below the Roth IRA income phase-out threshold, which means both Roth IRA strategies and Roth conversions carry a favorable tax cost.

Spouse 1 — The spousal IRA. Although Spouse 1 has no earned income of their own, a spousal IRA allows Spouse 2’s earned income to fund a contribution on Spouse 1’s behalf. As long as the couple files jointly and Spouse 2 has sufficient earned income, Spouse 1 can contribute up to $7,500 — or $8,600 with the catch-up if age 50 or older — to either a traditional or Roth IRA in their own name.

At the income level in this scenario, a Roth IRA is the recommended choice for Spouse 1. The current tax rate is likely lower than it will be if and when larger RMDs kick in from pre-tax accounts. Every dollar contributed to the Roth IRA now will grow and be withdrawn tax-free. There are no RMDs on a Roth IRA during the account owner’s lifetime, which provides additional planning flexibility.

The Roth conversion opportunity. This scenario also presents one of the most powerful Roth conversion windows available: the period after one spouse has retired but before RMDs begin and Social Security is claimed at its full level.

If Spouse 1 has significant pre-tax balances in a former employer’s 401(k) or in traditional IRAs, the gap years of early retirement — when taxable income is lower — are an ideal time to convert portions of those accounts to Roth IRAs. For a more detailed discussion of this strategy, including the interaction with Social Security and Medicare premiums, please see our April 2026 article on Roth conversions.

Spouse 2 — SEP IRA and Roth IRA. Spouse 2 has two natural vehicles: a SEP IRA for the immediate tax deduction on self-employment income, and a Roth IRA for tax-free future growth.

The maximum SEP contribution here is approximately 20% of net self-employment income — roughly $14,000 at this income level. Since the household savings target is $7,500, Spouse 2 does not need to maximize the SEP IRA; instead, the question is how to split the contribution between tax-deferred (SEP) and tax-free (Roth).

If Spouse 2 is enrolled in a qualifying HDHP and is not yet on Medicare, an individual HSA contribution of $4,400 (plus $1,000 if age 55 or older) is also available, offering additional tax-advantaged capacity.

Reaching the $7,500 target:

  • Spouse 1, spousal Roth IRA: $7,500 (or $8,600 with catch-up)
  • Spouse 2, Roth IRA: Additional $7,500 if desired (funded by Spouse 2’s earned income)
  • Spouse 2, SEP IRA: Optional — for additional tax deduction on self-employment income beyond the 10% target

To meet just the $7,500 target, the simplest path is a single spousal Roth IRA contribution for Spouse 1. But this couple has the capacity to do considerably more if they wish — and given the favorable income level and tax environment, doing more in Roth form is likely to serve them well.

Key insight. This scenario illustrates something that surprises many clients: a retired spouse can still build retirement savings, as long as the other spouse has earned income and the couple files jointly.

The spousal IRA is underused and underappreciated. Combined with the Roth conversion opportunity that retirement creates — often a multi-year window of lower taxable income before RMDs and Social Security crowd the picture — this couple has the tools to meaningfully strengthen their tax position in retirement, even on a modest income.

Closing Thoughts

The 2026 contribution limit increases are welcome news — they give savers a bit more room. But the greater opportunity lies in understanding how these accounts work together. A 401(k) and an HSA and a Roth IRA and a SEP IRA are not competing options. For the right family, they are complementary layers of a single, coherent strategy — each account doing a specific job, in a specific tax “bucket,” for a specific purpose.

The right combination for your family depends on your income, your employment situation, your age, your proximity to retirement, and your tax picture today versus what you expect it to be in the future. There is no one-size-fits-all answer — which is exactly why we model these decisions individually, account by account, year by year.

If you have not recently reviewed how your current contributions are structured, or if your situation has changed — a new job, a shift to self-employment, a spouse entering or leaving the workforce, or an approaching retirement — this is an ideal time for a conversation. We are here to help you make the most of every dollar you put to work for your future.

Should You Convert to a Roth? What Every Client Should Know

Few strategies in retirement planning generate as much discussion — or as much confusion — as the Roth IRA conversion.

Used wisely, a Roth conversion can meaningfully improve your long-term financial picture. Used carelessly, it can trigger an unexpected tax bill, higher Medicare premiums, and greater taxation of your Social Security benefits.

In this article, we walk through the essential considerations so you can approach this topic as an informed participant in your financial plan.

What Is a Roth Conversion?

A Roth conversion involves moving money from a tax-deferred account — such as a traditional IRA, 401(k), or 403(b) — into a Roth IRA.

The key trade-off is straightforward: you pay ordinary income tax on the amount converted today, in exchange for tax-free growth and tax-free withdrawals in the future.

Unlike a traditional IRA, a Roth IRA is not subject to required minimum distributions (RMDs) during the account owner’s lifetime, and qualified distributions are entirely income tax-free.

Anyone can execute a Roth conversion, regardless of income level. This is an important distinction: while high earners are prohibited from contributing directly to a Roth IRA above certain income thresholds, there is no income limit on conversions.

The Long-Term Case for Roth Conversions

The merits of Roth conversions are most compelling when viewed through a long-term lens. Here is why:

  • Tax-free compounding. Once funds are in a Roth IRA, all future growth is sheltered from income tax. For accounts that have decades to compound, this can translate into a substantially larger tax-free inheritance for you and your heirs.
  • RMD reduction. Traditional IRAs and pre-tax 401(k)s require you to take minimum distributions beginning at age 73, whether you need the money or not. These distributions are taxable as ordinary income, which can push you into higher tax brackets, increase the taxation of your Social Security benefits, and trigger higher Medicare premiums. Converting a portion of your pre-tax accounts to Roth reduces the size of your future RMDs — and the tax drag that comes with them.
  • Tax diversification. Having both taxable and tax-free income sources in retirement gives you far more flexibility to manage your tax bracket from year to year. Rather than being forced to draw entirely from taxable accounts, you can blend Roth withdrawals with other income to stay below critical thresholds.
  • Legacy planning. Roth IRAs can be powerful estate planning tools. Heirs who inherit Roth accounts receive income-tax-free assets, which can be especially valuable if they are in high tax brackets themselves.
  • Protection against future tax rate increases. Current federal income tax rates are historically moderate. Many financial planners believe rates will need to rise in the future to address long-term fiscal pressures. Converting at today’s rates locks in your tax bill before potential future increases.

When Are Roth Conversions Most Beneficial?

Timing is everything with Roth conversions. The goal is always to convert at the lowest possible tax cost. The following windows tend to be most advantageous:

  • The “gap years” — between retirement and age 73. This is the single most powerful window for most clients. If you retire at 62 or 65 but delay Social Security and have not yet begun RMDs, your taxable income may be the lowest it will ever be for the rest of your life. This creates an opportunity to fill up lower tax brackets — such as the 12% or 22% bracket — with conversion income before RMDs, Social Security, and other income layers crowd that space out permanently.
  • Before Social Security begins. As we explain in more detail below, once Social Security begins, each dollar of Roth conversion income can cause additional Social Security benefits to become taxable. Converting before benefits begin avoids this compounding tax effect.
  • Low-income years. A job loss, sabbatical, business down year, or large deductible expense (such as significant medical costs) can create a temporary window where your income is unusually low. These are excellent conversion opportunities.
  • After a market decline. If your IRA has declined in value, converting at the lower balance means paying tax on a smaller amount. When the market recovers, those gains accumulate tax-free inside the Roth.
  • Before ages 63–64 (for those approaching Medicare). Because Medicare uses a two-year lookback to determine your income-related surcharges (IRMAA — explained below), front-loading conversions before age 63 or 64 can reduce or eliminate future IRMAA exposure. Once you are on Medicare, large conversions must be carefully calibrated to avoid crossing IRMAA brackets.

The Social Security “Crowding Out” Issue

One of the most underappreciated complications of Roth conversions is their interaction with Social Security benefits. This is an important point for clients who are receiving Social Security but with little or no other income.

A Roth conversion amount gets added directly to Adjusted Gross Income, which impacts whether Social Security benefits are taxed at 0%, 50%, or 85%.

When you receive Social Security, the IRS uses a figure called provisional income (also known as “combined income”) to determine how much of your benefit is taxable.

Provisional income includes your adjusted gross income, any tax-exempt interest, and half of your Social Security benefit. If this figure exceeds $25,000 for a single filer or $32,000 for a married couple, a portion of your Social Security becomes taxable — up to 85% at higher income levels.

Here is where conversions become costly after Social Security begins: each dollar you convert to a Roth increases your provisional income, which in turn can cause more of your Social Security benefit to become taxable.

The result is a compounding tax effect — you are effectively taxed on both the conversion amount and on an increased share of your Social Security benefit.

The practical implication: For most clients with significant pre-tax IRA balances, the highest-value Roth conversions happen before Social Security begins, during those “gap years” when income is lower and provisional income is easier to manage.

Once Social Security is in payment, conversions can still make sense, but the amounts should be modeled carefully to avoid triggering this compounding effect inadvertently.

Roth Conversions and Medicare IRMAA

If you are on Medicare — or approaching it — Roth conversions require an additional layer of analysis because of the Income-Related Monthly Adjustment Amount (IRMAA).

IRMAA is a surcharge added to your Medicare Part B and Part D premiums when your Modified Adjusted Gross Income (MAGI) exceeds certain thresholds.

For 2026, IRMAA surcharges begin at $109,000 MAGI for single filers and $218,000 for married couples filing jointly. The surcharges operate on a tiered “cliff” structure, meaning that crossing a threshold by even one dollar can increase your annual Medicare premiums significantly.

The two-year lookback. The critical planning wrinkle is that your 2026 IRMAA is based on your 2024 income — not your current income. This two-year lag means that a large Roth conversion you execute today will not affect your Medicare premiums for another two years.

Conversely, a large conversion you did two years ago may be triggering higher premiums right now.

The numbers are real. In 2026, the IRMAA surcharge for Part B can range from an additional $81.20 to $487.00 per person per month, depending on income tier.

For a married couple both on Medicare, a conversion that pushes income into the next IRMAA bracket could cost more than $1,000 in additional annual Medicare premiums per person — sometimes negating much of the tax benefit of the conversion itself.

What this means for planning. The goal is not to avoid Roth conversions out of fear of IRMAA — it is to convert strategically, staying below IRMAA thresholds where possible, and in amounts that optimize the long-term benefit against the near-term premium cost.

Once Roth conversions are complete and your RMDs are reduced (or eliminated), future Roth withdrawals do not count toward MAGI at all, which can dramatically reduce your long-term IRMAA exposure.

The short-term surcharge, properly weighed, may well be worth the long-term premium savings.

When a Roth Conversion Is Not Recommended

As valuable as this strategy can be, Roth conversions are not universally beneficial. Here are the situations where we would typically advise caution or decline to recommend a conversion:

  • Your tax rate today is higher than you expect in retirement. If you are currently in a high bracket and expect significantly lower income in retirement, deferring taxes makes more sense. Pay taxes later at a lower rate, not more taxes now at a higher one.
  • You cannot pay the tax with outside funds. The best Roth conversions are funded with non-retirement assets — money in a taxable brokerage account or savings — used to pay the tax bill. If you would need to withdraw additional funds from your IRA to cover the tax, the conversion becomes far less efficient and potentially counterproductive.
  • You have a short time horizon. Roth conversions take time to deliver their benefits. If you are in poor health, have a limited life expectancy, or need the funds in the near term, the upfront tax cost may not be recouped.
  • The conversion would trigger an IRMAA tier jump that outweighs the benefit. If a conversion amount would push you over an IRMAA cliff — adding thousands in Medicare premiums over multiple years — the math may not work in your favor, particularly for smaller conversion amounts.
  • The conversion would make a greater portion of Social Security taxable. As discussed above, if you are already receiving Social Security and a conversion would significantly increase the taxable portion of your benefit, the effective tax rate on the conversion may be far higher than it appears.
  • You expect to leave assets to charity. If your primary beneficiary is a charitable organization, keeping funds in a traditional IRA may be preferable — charities pay no income tax on inherited IRAs, so the tax deferral benefits accrue to a tax-exempt entity rather than generating a tax bill for you today.

A Note on Process

Roth conversions require careful coordination between your financial plan and your tax return.

At Moore Financial Advisors, we use financial planning software to model conversion scenarios across multiple years, analyzing the interplay between your tax brackets, RMDs, Social Security, IRMAA, and investment returns.

We recommend working in close collaboration with your CPA or tax advisor, because the final conversion decision and execution must be informed by your complete tax picture for the year.

If you have not recently discussed Roth conversion opportunities with us — particularly if you are approaching retirement or newly retired and have significant pre-tax retirement assets — we encourage you to reach out.

The window for the most tax-efficient conversions is finite, and early, thoughtful planning is far more powerful than later-stage adjustments.

Dealing With Dissonance

Many of us are feeling a degree of dissonance today—an uncomfortable gap between what we sense in the world around us and what we know we should do with our long‑term financial plans.

Some clients have expressed a version of the following sentiment: “I’m worried about where the country is heading. Maybe we should reduce risk until things settle down.”

This reaction isn’t irrational. It’s human. When the social or political climate feels tense, uncertain, or discouraging, it’s natural to want to create stability somewhere—and the easiest lever to reach for is the investment portfolio. Wanting safety when everything feels unsafe is an understandable impulse.

But as understandable as it is, history tells us that making portfolio decisions based on fear, dismay, or frustration with the state of affairs has consistently been a poor long‑term strategy. Not because the feelings are wrong, but because they rarely correspond to actual economic fundamentals.

In this article, I want to do three things:

  1. Acknowledge the emotional reality many people feel today.
  2. Explain why pessimism and portfolio management don’t mix well.
  3. Offer a more constructive framework for evaluating your financial future—one grounded in economic resilience, not political anxiety.

Why We Feel Dissonance

When external events feel chaotic or divisive, we instinctively brace ourselves. Our brains have evolved to treat negative information as a call to action. In other words, the more unsettled we feel, the more likely we are to seek swift, protective measures.

In personal finance, this often leads to two common urges:

  • The desire to reduce risk (“Let’s lower stock exposure for now.”)
  • The urge to protect gains (“The market has done well; maybe we should step aside before things turn.”)

These feelings do not arise because of portfolio conditions—they arise because of life conditions. And the danger is that we adjust our portfolios based on emotion, rather than based on data and long-term requirements.

This is the core of the dissonance: the world around us can feel worse even while the economy and markets continue to function, adapt, and grow.

Why Acting on Pessimism Is Historically Counterproductive

  • Feelings do not predict financial outcomes. Researchers have repeatedly found that consumer sentiment, political sentiment, and investor mood frequently diverge from actual market performance. At various times in history, Americans have felt deeply pessimistic about the nation’s direction—even during periods of strong corporate earnings, rising GDP, and resilient labor markets. Markets care about productivity, innovation, interest rates, earnings, global demand, cash flow, corporate reinvestment, and labor efficiency—not the daily emotional climate of society.
  • Major market gains often occur during times of maximum discouragement. Some of the strongest market performance has happened in years when public confidence was especially low. Market behavior is forward‑looking, and investors who wait for “things to feel better” often end up missing out on significant positive returns.
  • The long‑term track record of disciplined investors tends to be strong. Over any extended timeframe—20, 30, 40 years—the U.S. stock market has shown remarkable resilience. It has grown through wars, recessions, inflationary cycles, political polarization, technological disruption, global crises, and periods of profound national division.

What Actually Deserves Your Attention Right Now

  • The broader health of the U.S. economy. Even in times when the social mood is sour and politics are polarized, economic fundamentals can remain robust. Employment, consumer spending, corporate investment, productivity growth, innovation, and global demand all play central roles in shaping market performance. Today, many of these fundamental economic indicators are trending in a positive direction.
  • The resilience and adaptability of companies. Most successful companies are not fragile—they are adaptive organisms. They evolve in response to changing consumer preferences, technological shifts, supply chain challenges, and cost pressures. And the stock funds selected for your portfolio tend to emphasize large, well-managed, profitable companies.
  • Your personal financial plan—not the news cycle. Your investment strategy is built to support your retirement timeline, spending needs, risk tolerance, tax situation, and estate planning goals. Adjustments should be made in the context of these factors, and not in reaction to political developments.

How to Navigate the Dissonance Productively

  • Acknowledge the emotion without acting on it. It’s OK to feel unsettled. The goal is not to eliminate the feeling—just to prevent it from dictating your financial decisions.
  • Use data, not moods, as decision inputs.
  • Reaffirm your long‑term purpose. Your portfolio is designed to support your life for decades, including years when the world feels off‑kilter.

If you’re experiencing dissonance today, you are not alone. Susan, Donna, Alex and I are here to address your concerns and help you stay the course with your investment strategy and your financial plan.

-RK

What Comes Next?

One question at the forefront of many investors’ minds, particularly at the start of a new year is: how might things unfold in the year ahead?

There are cognitive, cultural, and practical reasons why this question is more relevant to us in January than at other times of the year.

From a cognitive perspective, most people find it easier to simplify continuous time into “mental containers”. Chunking time into blocks (like one year) gives the brain manageable units for memory, planning, and comparison.

Culturally, society reinforces annual cycles. Many institutions – from government and schools to private sector employers – organize life around yearly cycles, so we tend to internalize these rhythms and learn to think in this format automatically.

From a practical perspective, year-long blocks match human-scale planning. A year is short enough to imagine, plan for, and track, but long enough to realize meaningful change.

It is important to recognize that, for planning purposes, what happens in the financial markets over the long term is far more important than what occurs tomorrow, next month, or in any one particular year.

Return Expectations

  • Stocks: given three very strong years of stock market returns (nearly 23% annualized from 2023 – 2025), it’s prudent to expect lower returns for stocks going forward: a 7% – 10% return range is a reasonable expectation for 2026. Note that over the very long term (past 100 years) stocks have returned an annualized 10.5%, according to Siblis Research. Also note that JP Morgan Asset Management’s well-regarded research team projects stocks will return a bit under 7% over the next 10-15 years. These are two important reference points to consider when forming an expectation for stock returns in the year ahead.
  • Bonds: return prospects for intermediate-term bond funds are sound:10-Year Treasury bond yields remain above 4%; the Bloomberg US Aggregate Bond Market Index’s yield to maturity is close to 4.5%; and JP Morgan expects 5.2% return for investment grade bonds in the years ahead. So, targeting a 4% – 5% return range for high-quality bonds is a reasonable expectation for 2026.
  • Cash: 3-Month Treasury bill yields are a good reference point for forming a return expectation on cash invested in very short-term, high-quality securities or money market funds. T-Bills currently have an annualized yield of 3.6%, and yields are likely to decline if the Federal Reserve continues to bring down short-term interest rates. So a 2.5% – 3.5% return range on invested cash is a reasonable expectation for 2026.

Risks

  • Policy Risk: Surprise economic policies from the Trump administration, including the potential for imposition of higher tariffs for political purposes, pose a major potential risk for financial markets in 2026.
  • AI Risk: Investors are optimistic that the vast resources that technology-focused companies are plowing into Artificial Intelligence will pay off quickly; if positive AI-related sentiment cools (for whatever reason) it likely would mean downward adjustments for tech company shares and probably a broader-based slump for the stock market a whole.
  • Labor Market Risk: Many households and workers feel that the jobs market is not working particularly well. In 2025, there was a sizable increase in the unemployment rate. It wouldn’t take that much more labor market deterioration for economists to start worrying about the increased possibility of recession.
  • Financial Market Risk: The risk of a steep and extended stock market decline in any given year resulting from problems in the financial markets should never be ruled out. However, current economic conditions are more likely to support growth and positive financial market returns. Instead of girding for the next crash, it’s more constructive to mentally prepare for episodes of stock selling and price fluctuations which typically happen over the course of a year.

The previous bullet point is worth expanding upon. The chart below, courtesy of JP Morgan Asset Management, is one to keep in mind. It shows that annual returns for US stocks are usually positive and often satisfactory, but that intra-year downdrafts are part of the investment landscape.

Annual Returns and Intra-Year Declines for the S&P 500, 1980 – 2025

Source: JP Morgan Asset Management

The key take-aways from the above chart are:

  • During the course of any given year, the S&P 500 Index of large-company US stocks falls, on average, by 14.2% (red dots show intra-year declines)
  • Going back to 1980, annual stock market returns have been positive in 35 of 46 years, or three-quarters of the time
  • The average annual return for large-company US stocks over the past 46 years has been 10.7% (grey bars show full-year returns)

-RK

Clichés for Investing

I love a good cliché. So, let’s not beat around the bush. Let’s bite the bullet, cut to the chase, and talk turkey: some investors are really worried that we’re in the calm before the storm.

In conversations with clients during the past month, I’ve detected a higher than usual level of anxiety.

Perceived pernicious policy priorities pursued by the current administration, along with highly polarized politics and debased social dialogue are amping up concerns about what comes next.

The propensity to extrapolate is natural. If part of the picture (political-social) seems out of focus or out of whack, shouldn’t that eventually affect other parts (economic-financial) of the landscape? Possibly, but also neither necessarily nor probably.

But looking at the horizon through economic and financial market lenses, the outlook appears to be fairly constructive as we approach 2026.

For inveterate worrywarts (a group of which I am a card-carrying member), here are some recent economic and financial observations to keep in mind:

  • Jobs: the labor market is healthy; the Department of Labor’s weekly jobless claims data signals a labor market that is neither cracking or overheating; some economists describe the current situation as “no-fire, no-hire” and “softer”, which, though different from the exceptionally strong demand for labor situation after the pandemic, still remains supportive for the economy
  • Income: wage gains for workers are expected to continue in 2026 according to surveys conducted by groups like Payscale and Mercer, likely in the range of 3.0% – 3.5%, down slightly from 2025 (but outpacing inflation); Goldman Sachs expects real disposable personal income (a broader measure of spending power than wage gains) to grow more than 4% in 2026
  • Loan Delinquencies: about 5% of the US population is experiencing third-party collections (being pursued by an independent agency to recover overdue debts) which quite low by historical standards and an indication of consumer health
  • Trade: the US-led trade war started in March and accelerated in April; but trade deals were signed with different countries over the summer and into the fall, stabilizing trade relationships and improving prospects for economic growth
  • Demand: a recent study by the San Francisco Fed shows that strong economic activity and strong demand for goods and services accounts for the majority of price growth in the economy; this is an improvement over the post-pandemic situation, where inflation was primarily a function of supply chain issues and supply shocks
  • Taxes: The nonpartisan Congressional Budget Office estimates that changes in tax law are likely to boost economic growth by nearly one percentage point in 2026.
  • Profitability: US companies, in aggregate, remain very profitable; in Q3-2025, large US companies grew earnings by 12% compared to a year ago; the delayed impact of lower interest rates will be supportive for company profits in 2026; and high profitability is generally supportive of stock prices

Regarding investments, many asset prices are unquestionably high. We’ve experienced three strong years of stock market returns: 26% in 2023, 25% in 2024, and 18% year-to-date in 2025.

While lofty stock market levels present some potential vulnerability for portfolios, it’s important to keep in mind that pullbacks and corrections are a normal part of investing.

In Q1 2023, stocks dropped by 9%. From mid-July to mid-August 2024, stocks declined by 8.5%. In 2025, stocks hit a new all-time high in February and then proceeded to fall 19% by early April.

Crises that lead to deep bear markets and long-term asset impairments thankfully occur once in a blue moon.

Part of my approach as a financial advisor is to keep my ear to the ground for behavior, developments, and situations that may sow the seeds of the next crisis.

There are a few situations that I am keeping my eye on, including:

  • outsized borrowing by giant technology companies to fund AI-related investments
  • the push by large investment firms to “democratize” access to private investments
  • recent appearance of fraudulent activity (including at Tricolor and First Brands) that have resulted in sizable corporate bankruptcies

But for now, investors likely will be well-served to continue to go with the flow, and there is a reasonably good chance that in December 2026 we’ll be able to say, “all’s well that ends well”.

Understanding Sustainable Investing

The battle against climate change is becoming near omnipresent. From electric cars to solar energy to the increasing popularity of reusable water bottles, many people are now more conscious than ever of the indirect costs of their actions.

Sustainability extends beyond consumer products and clean energy.

With increasing conscientiousness, sustainable investing enables investors to align their values with their financial goals.

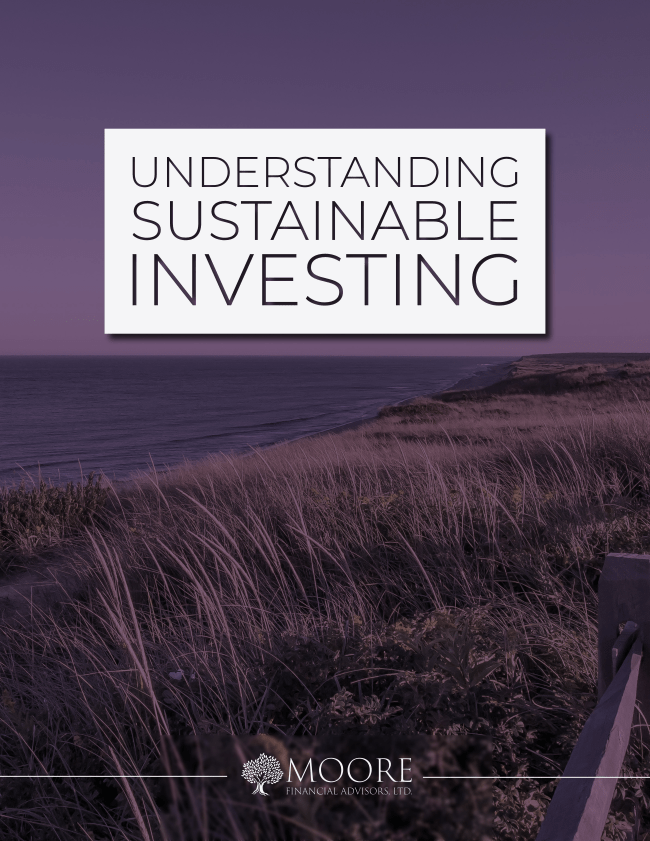
The attached paper, Understanding Sustainable Investing, was authored by our summer intern Greg Kania (who has since decamped to finish his final year of undergraduate work).

This paper gives background on sustainability in the investment space, and will be of interest to those who are curious about ESG and SRI, as well as to investors who are already employing sustainable investing strategies.

Here’s a summary of what the paper seeks to do:

  • define and contextualize various sustainability terms
  • provide a history of sustainable investing
  • discuss greenwashing
  • present ESG scoring methodologies
  • update readers on recent trends
  • address the question: am I likely to forgo returns if I choose a sustainable investment strategy?

Click on the link above or the image below to download.

We hope you find the paper useful, and we welcome your comments!

-RK

Hold ’em, Don’t Fold ’em

Kenny Rogers revealed his ideas about what to do at the poker table when he sang; “you got to know when hold ‘em, know when to fold ‘em, know when to walk away, and know when to run.”

Roger’s wisdom may ring true for gamblers, but it is much less useful for investors. John C. Bogle’s ideas and approach to investing are more apt to yield positive long-term results.

One of the four “investment giants” of the twentieth century (according to Fortune Magazine), Bogle was a founder of The Vanguard Group and was known for doing well by Main Street.

He had a strong conviction that focusing on the long term was the best approach for individual investors.

Bogle appreciated the classics, and was fond paraphrasing Shakespeare’s MacBeth, asserting: “the daily machinations of the stock market are like a tale told by an idiot, full of sound and fury, signifying nothing.”

He went on to say: “Don’t let all the noise drown out your common sense and your wisdom. Just try not to pay that much attention, because it will have no effect whatsoever, categorically, on your lifetime investment returns.”

During periods such as April, when the ebbs and flows of the financial markets are extreme, it’s important to remember Bogle’s words of wisdom.

In theory, it’s easy to get on board with what Bogle is saying.

In practice, however, it is difficult to “not to pay that much attention” when stock prices are gyrating and when you are witnessing daily declines in your portfolio’s value.

Since April’s mini-panic has subsided, investors may have an easier time considering the following, which support the “hold, don’t fold” principle:

  1. Large stock market declines are typically closely followed by large stock market rallies.
  2. Selling during today’s downswing can be detrimental, because it increases the chances that you’ll miss the benefits of tomorrow’s upswing
  3. Bear markets are infrequent (but not rare) and are typically unpredictable. Preparing for a rough ride in the near-term, while anticipating a smooth ride over the long-term, is a prudent approach.

Below are charts, with additional commentary, that illustrate these points.

Worst Days and Best Days Tend to Cluster Together

This chart shows the worst 50 days and the best 50 days in the stock market from 1997 through 2024, courtesy of Goldman Sachs Asset Management.

Source: Goldman Sachs Asset Management

GSAM says the time between the worst day in a drawdown and the best day of the subsequent recovery is often as little as 2-8 days.

If this chart were to be extended into 2025, early April would have featured prominently, when large company US stocks fell by nearly 5% on 4/3 and 6% on 4/4 – then shot up by 9% on 4/9.

If you’re tempted to sell stocks after a big market decline, keep this chart in mind. If you sell on the downswing, you’re likely to miss the upswing.

The 10 Best Days of Each Year Make All the Difference

Here’s another lens on the good days / bad days concept: since 1990, missing just the ten best trading days each year would have turned the S&P 500’s average positive return of +15.1% into an annual loss of -18.0%, on average.

Source: Goldman Sachs Asset Management

The chart above extends back to 2000, and shows actual annual returns in dark blue, paired with what annual returns would have been if investors missed the ten best trading days of the year.

The lesson: hold through the downs and the ups. Selling when the market is down means you run the risk of missing recoveries, which can be detrimental to your long-term wealth.

As hard as it may be psychologically to persevere when the outlook is gloomy and stock prices are falling, it most often is the right thing to do.

Markets Reward Long-Term Investors

The next two images show that being in the markets for the long haul is the best way to handle volatility, which is a feature of the stock market.

This table, courtesy of Capital Group, maps out the nine largest market declines during the past two decades, and puts what just occurred in April, labeled “Trump Tariff Tremor” into context.

Source: Capital Group

The events in purple font are corrections, where the stock market (S&P 500 Index of large company US stocks) has declined by between 10% to 20%.

Most of the time in instances where the market corrects, the decline is quick and sharp, and stocks recover quickly.

The “Trump Tariff Tremor” in black font a significant event, and the market activity was in line with other corrections. While stocks haven’t fully recovered to their most recent peak, the upswing from the April 8 “bottom” has been 14% as of May 2.

The events in green font are more severe bear markets, where the stock market has declined by more than 20%.

Recovery typically takes some time after the bottom of a bear market is reached. But in both types of down markets – Corrections and Bear Markets – long-term investors are rewarded for staying the course.

The last chart, also courtesy of Capital Group, is a complement to the previous table and shows the path of the S&P 500 Index of large-company US stocks for the past 20 years.

Source: Capital Group

The shaded areas map out the bear markets in green and the corrections in purple.

Through it all, the US stock market return has averaged about 9.25% per year. A $1,000 investment on January 2004, would have appreciated to approximately $5,888 over the twenty-year period.

Hopefully, this data can help you recognize the trees (short-term), enable you to see the forest (long-term), and support your resolve to stay committed to your investment strategy and your financial plan.

-RK

Your Guide to Sustainable Investing

Summer Reading Series: Personal Finance

Your Essential Guide to Sustainable Investing by Larry Swedroe and Samuel Adams

Since the start of my internship, I have learned that half of the knowledge requisite to work in finance is knowing financial acronyms and jargon. I say this jokingly, however I do believe that there is a kernel of truth to it – particularly in the space of sustainable investing.

Your Essential Guide to Sustainable Investing makes complex and multifaceted concepts, like Environmental, Social, & Governance (ESG) ratings, Socially Responsible Investing (SRI), and Impact Investing, digestible and approachable.

As explained by Swedroe and Adams, sustainable investing empowers investors to quite literally put their money where their mouth is by way of aligning one’s values with their investments, without sacrificing financial returns.

Becoming familiar with the ins and outs of sustainable investing terminology and investment management approaches, and how it all may impact one’s portfolio can only benefit the curious and engaged investor, and Your Essential Guide to Sustainable Investing is a great place to start.

-Greg

Avoiding the Pain Trade

On May 22, the Dow Jones Industrial Average, one of the oldest stock indices in the US (made up of 30 “blue chip” stocks), reached a new all-time high of 40,000.

Other more broadly-based indices such as the S&P 500 index (large-company stocks) and the Nasdaq Composite index (heavily weighted toward tech stocks) also attained fresh highs in mid-May.

The stock market can be viewed as a mirror of sentiment and as a measure of value, and new highs tend to be well received by investors. Strong demand for stocks has boosted prices and has created pleasing portfolio returns.

Regarding sentiment, most Wall Street prognosticators are bullish. In fact, the ranks of Negative Neds and Nellies recently faded from two to one.

The lead strategist at Morgan Stanley, well-known for his persistent bearish views, revised his 12-month stock market target sharply higher in May. Of seven leading investment banks, JP Morgan is the only firm anticipating a significant market decline by year end.

Even though the economic and market backdrop is constructive, a contrarian would suggest that stocks are climbing a wall of worry.

 As we consider the situation at home and overseas, there’s plenty of cause for concern, including:

  • the rising costs of goods and services have made everyday living ever more expensive for consumers
  • a deeply polarized political environment in the US raises concerns about the possibility of civil disorder and the potential degradation of democracy
  • persistent conflict abroad is affecting the lives of millions

Worried investors who are overly pessimistic about the economic, political, or social landscape might be tempted to say “enough is enough.” Acting on this conviction by selling a significant portion of stock holdings likely would provide an immediate sense of relief for those seeing the glass as half full.

But this type of action invites the “pain trade”, where financial markets punish investors for their decisions, typically in the form of substantial losses or a missed opportunity for upside.

The pain trade for worried investors who sell their stocks today would occur if the stock market rally of 2023-24 proves persistent.

Nicholas Colas of DataTrek Research provides the following pointers for avoiding the pain trade (via a recently published article in Barron’s):

  • Don’t be irked by short-term losses; it’s better to endure a 20% to 30% dip, typical for bear markets, than to miss out on all of an investment’s future gains
  • Trust in the prospects of large company US stocks, which consistently deliver for investors over the long term

The adage “it’s time in the market, not timing the market, that matters” might cause a wince or an eye-roll from experienced traders. But consider the chart below, courtesy of AMG, which tracks cumulative returns of US large company stocks.

The yellow dots denote twelve major market pullbacks, starting with the Great Depression in 1929. The dark green shaded areas show the stock market rallies.

Two key take-aways:

  1. rallies tend to run on for extended periods, while sell-offs are typically sharp (and painful) but far shorter in duration
  2. the peaks historically have risen far higher during rally periods than the troughs have fallen during sell offs

Perhaps the phrase “it’s time in the market that matters” might serve as a helpful reminder of the benefits of cultivating a patient approach to investing and embracing long-term thinking when it comes to your personal financial situation.

Summing it up, DataTrek’s Colas offers the following: “In the end, the worst pain trade is being underinvested.”

RK

Investment Marathoners

Investing is a marathon, not a sprint. This adage may seem a bit time-worn, but nevertheless appropriate given the recent conclusion of the 128th running of the famed race in Boston.

I have had a long relationship with the sport of running, and although my lane has been distance, I’ve always admired sprinters. They approach competition with a narrow focus, execute with maximum intensity, and learn the results of their efforts in a matter of seconds.

And truth be told, I am intrigued by investment sprinters, too, who have a lot in common with track sprinters. For example, I’ve observed professional traders staying narrowly focused on their task and applying a high degree of mental energy throughout a trading session.

Typically, investment sprinters have quick reaction functions. Buying and selling tends to happen frequently under their watch, and investment sprinters try to make profits quickly while avoiding large losses.

I’m also intrigued by investment sprinters because their mental wiring and their market approach is so foreign. In philosophy and in practice, I identify with investment marathoners.

For investors in it for the long haul, lots of buying and selling doesn’t make much sense. Investment marathoners keep long-term objectives in mind. They develop a plan, stick to the plan, and expect to measure success over an extended timeframe.

Investment marathoners share the desire with investment sprinters to avoid large losses, but cutting a loss quickly isn’t part of the approach. Investment marathoners know the environment will include downturns along with market gains and can get comfortable with discomfort for periods of time.

Even though they understand the investment landscape, investment marathoners can get worn down and can become discouraged when the course gets challenging – that is, when prices go down instead of up and when portfolio values drop instead of rise.

The following two charts, courtesy of JP Morgan Asset Management, can be particularly useful in helping investment marathoners maintain perspective.

The first chart below shows what has happened each year in the US stock market for the past 44 years.

The grey bars show annual returns. The red dots show intra-year drops and refer to the largest market drops from a peak to a trough during each year.

Source: JP Morgan Asset Management

Important statistics from this first chart:

  • 10.3%: average annual stock market return
  • 14.2%: average intra-year stock market drop
  • 75%: percentage of time annual returns for stocks have been positive

When the stock market is in one of its periods of decline, the learning from this chart is worth remembering: you can expect stocks to take a tumble during the year, but there’s a high likelihood that returns will finish the year in positive territory.

The second chart shows what has happened for various asset classes over time and highlights the benefit of investing for the long term.

The green bars depict stock market performance, the blue bars bond market performance, and the grey bars performance of a portfolio of 60% stocks, 40% bonds. The bars show the range of returns over 1-year, 5-year, 10-year, and 20-year “rolling” periods, from 1950 to 2023.

For example, the left most bar considers stock market returns for all one-year periods from 1950 to 2023. The highest one-year return was 52%. The lowest one-year return was -37%.

Moving to the right, the next green bar considers stock market returns for all 5-year periods during the same 73-year timeframe. The highest annual return during any 5-year period was 29% and the lowest annual return for any 5-year period was -2%.

Source: JP Morgan Asset Management

Key points from the second chart:

  • Annual returns compress the longer you stay invested
  • The downside diminishes the longer you stay invested
  • With a long enough holding period, expect significant, positive returns

Distance running isn’t for everyone. The mind must be willing, and the body must be able to work hard to get to the finish line.

But investment marathoning is accessible to everyone. All it takes is the right plan, a commitment to stay the course, and confidence to let the financial markets do the hard work (and generate satisfactory returns) over the long term.

-RK