Category

Investment Strategy

The New, New Thing: A Bitcoin Story

In 1999, author Michael Lewis published The New New Thing: A Silicon Valley Story, about Jim Clark, a technology entrepreneur who helped launch the age of the internet. Also in that year, technology stocks (as measured by the Nasdaq index) rose by 86%. The following year, as the internet bubble burst, the Nasdaq plummeted by 77%

Since its launch in 2009, the cumulative price increase of Bitcoin has been astounding: a mere $100 purchase of Bitcoin in 2010 would be worth millions today.

But the year-to-year return from holding Bitcoin during the past half decade has been noteworthy due to wild price swings, more akin to the tech stock experience of the late 1990s – early 2000s. In the crypto crash of 2022, the Bitcoin price declined by 65%. More recently, the price has climbed by a similar amount.

Until this year, owning Bitcoin has been more challenging than buying stocks or bonds. Typically, Bitcoin aficionados needed to do things like create a digital wallet or open an account on a specialty crypto exchange to hold their coin.

The “New, New Thing” in 2024 is that Bitcoin can now be bought and held in a standard brokerage account or IRA, just like a run of the mill stock, bond, or mutual fund.

On January 10, the US Securities and Exchange Commission (SEC) authorized eleven applications to offer exchange-traded funds (ETFs) tied to Bitcoin.

Since the question of “can I buy it?” has been answered with the advent of Bitcoin ETFs, more investors may now be asking “should I buy it?”

We encourage our clients to think long-term and prioritize well-diversified portfolios that support their financial plans. It’s not a crazy notion to think that an allocation to Bitcoin would add to the diversity of a portfolio and might contribute to wealth creation over time.

Some market practitioners equate Bitcoin to “digital gold”. Actual gold has been recognized as a store of value for centuries due to its durability, fungibility, and scarcity. While fourteen years probably falls short of a true durability test, Bitcoin does check the boxes of fungibility and scarcity, so the digital gold claim is not without merit.

Other folks are turned off by the idea of Bitcoin because of its association with illicit transactions. Since it is possible to hold actual Bitcoin in a wallet that is delinked from an exchange and not hooked up to the internet, cryptocurrency is a favored medium of exchange for malefactors.

The question of “Should I buy it?” is best considered through a lens of personal values and preference. A more appropriate question for an advisor to answer is “Must I buy it?”

For most individual investors, some mix of stocks or stock funds; bonds or bond funds; and short-term investments are appropriate and required to meet long-term financial goals. Stocks, bonds, and short-term investments are the must-haves in a typical investment portfolio.

Stocks provide an important growth element. A stock’s price is influenced by the profitability and sustainability of the enterprise that issues it. Over the long-term, there is a high likelihood that a diversified stock allocation will exceed the rate of inflation and enable the holder to maintain or improve their purchasing power.

Bonds and bond funds deliver regular income and often act as an offset when stock prices stumble. Bonds are contractual arrangements that promise their holders income and return of principal. Short-term investment funds also include contractual arrangements and typically provide stability with modest returns.

Commodities, on the other hand, are not tied to profitability of an entity, nor are they contractual arrangements that promise a return. Commodities are economic goods with fungibility whose prices are influenced primarily by supply and demand and are often the subject of speculative activity.

As such, we typically don’t include commodities directly as elements of investment portfolios for our clients: no gold ETFs, no oil ETFs, no funds whose sole purpose is to have direct exposure commodities. Since I view it as a commodity, Bitcoin is not a portfolio “must have”.

Another twist on the cryptocurrency narrative is its treatment under the law. The Commodity Futures Trading Commission treats cryptocurrencies as a commodity; the SEC argues that certain cryptocurrencies should be considered securities; and the Internal Revenue Service treats crypto as property.

While the latest Bitcoin ETFs won’t be popping up as a constituent in our model portfolios any time soon, you should know that digital assets are being viewed very seriously as investment vehicles by many large institutional investors.

Also, cryptocurrencies offer interesting technological applications that are being explored by financial institutions and even by central banks.

At a minimum, it’s worthwhile for informed investors to have some perspective on developments in the digital asset space. If you have questions, please send them our way.

RK

New Year, New Narrative

At the start of 2023, a hot topic among the Wise People of Wall Street was not if, but when, the US economy would slide into recession. Some prognosticators were calling for another precipitous drop in stocks, too, after an 18% decline in 2022.

As often is the case, reality differed significantly from projections.

With the turn of the calendar to 2024, there’s a whole new narrative by the smart-set forecasters. Today’s commonly held views about the US economy and financial markets are:

  • Jobs market will weaken
  • Economy will stall but not fall into recession
  • Inflation will continue to decline
  • Federal Reserve will start bringing down interest rates
  • Financial market returns will be about average: in the neighborhood of 8% for stocks and 4% for bonds

I think this is all quite reasonable. It’s helpful to begin a year by setting expectations, and the ones listed above are modest and fall well within the realm of possibility. But no one really knows what shape the economy, or the financial markets, will be in a year from today.

When writing to his clients during the financial crisis of 2008, Howard Marks, the Los Angeles-based money manager, shared his favorite quote from the esteemed economist John Kenneth Galbraith: “There are two kinds of forecasters: those who don’t know, and those who don’t know they don’t know.”

As a financial advisor, it’s good to keep this in mind. It’s also important to draw from past experiences and seek to understand what’s going on in the current environment, to provide the best possible guidance to clients on what is likely to happen in the long term.

Below, I’ve presented a table of returns related to Stocks, Bonds, and Cash, which are the main building blocks for many client portfolios.

The recent experience of returns from stocks and bonds differs from what you might expect to receive as an investor with a long time horizon.

(Source: Morningstar; Aswath Damodaran; *JP Morgan Asset Management)

You’ll also notice that projected returns for the Next 10 Years* (last column, blue font), from JP Morgan’s extensive Long Term Capital Markets Assumptions study, are moderate and more in line with the long-term historical experience (25 Years) than returns realized in more recent years.

While these statistics are informative, a picture can often provide additional clarity. The graph below presents another view of the long-term return experience for stocks, courtesy of Capital Group.

(Source: Capital Group; Stock index depicted is MSCI All Country World Index)

The picture catalogues many scary (and some tragic) events that have happened during the past thirty-five years, superimposed on the value of a standard global stock market index.

If you narrow your vision to a particular segment of the graph, you’ll see the stock index line swinging up and down, with many unfavorable outcomes in shorter periods corresponding to unfavorable events. Over the short-term, buying stocks seems to be a hit-or-miss activity.

But if you widen your vision to take in the whole graph, you’ll see episodes of volatility as part of a long-term, upward sloping, positive trend. If you decide to own stocks for the long-term, the odds of a positive result move decidedly in your favor.

There likely will be surprises in 2024, and we can imagine that some of the potential outcomes might translate to unfavorable results for your portfolio. It’s advisable to be prepared for downside scenarios.

But I also recommend that you ready yourself for a ho-hum year of pedestrian returns, as well as another year of terrific performance. By taking this approach, you’re mentally prepared for whatever unfolds in the year ahead.

Investors should focus on staying invested and diversified rather than reacting to surprises that come out of left field. Sticking to a financial plan that is designed around long-term goals, and a portfolio that supports the realization of those goals, remains the best way to achieve financial success.

RK

The Meaning of Magnificence (Stocks) and 5% (Bonds)

The financial markets have been influenced by two major themes in 2023.

For stocks, Artificial Intelligence (AI) has captured the imagination and the dominance of large technology companies has been a driving force.

For bonds, concern about inflation and the Federal Reserve’s reaction to it has been behind the persistent rise in interest rates. Read on for a discussion of what these themes mean for your investments.

Stocks: Less Magnificent

The seven largest technology companies in the US have been cheekily labeled the Magnificent Seven. Some may recall the film from 1960 by the same name, a Western about seven American gunslingers.

The 21st century capital markets version casts Alphabet (aka Google), Amazon, Apple, Meta Platforms (aka Facebook), Microsoft, Nvidia, and Telsa as the lead characters.

Year-to-date, the M7 are up about 80% on average. This compares to a gain of 10.6% for the S&P 500 Index, which is the benchmark for the 500 largest companies in the US.

Over the past five years, the M7 surged more than 200%, compared to about 27% for the S&P 500 (statistics courtesy of Clearnomics). Also worth noting is that the M7 comprise nearly 30% of the S&P 500 index.

Another way to think about the M7 phenomenon: if all the stocks in the S&P 500 were given the same weight – equally weighted, instead of weighted by the market capitalization, or relative size of each company’s stock – the stock market performance thus far for 2023 would be negative 2.5%. Which means that, on average, it really hasn’t been a great year for stocks.

As you might expect, legions of analysts and strategists have been diligently analyzing and prolifically prognosticating about this M7 phenomenon. In summary, the message from Wall Street: AI is a special technological development that will change the world.

These are great companies that make ingenious products, and they likely will continue to generate gigantic revenues and prodigious profits for the foreseeable future. However, “greatness” and “ingenuity” appears to be reflected in the M7 stock prices – and then some.

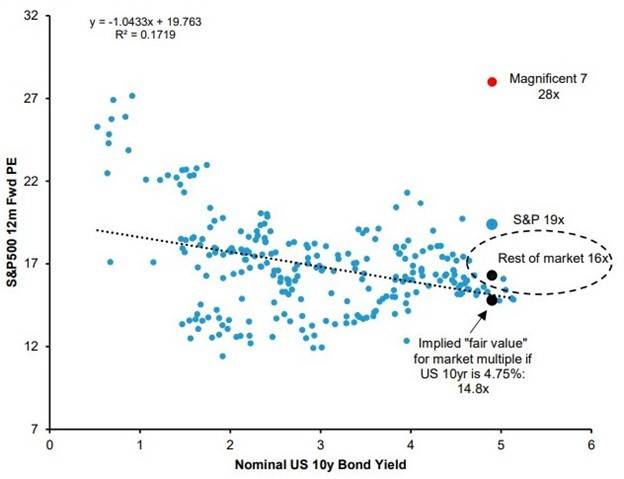
The chart below is an example of wonky Wall Street stock market research (this one produced by Richard Bernstein Associates and reproduced by Bloomberg). At a quick glance it might be hard to decipher, but upon closer study it highlights three important points about today’s stock market:

  • Big tech stocks (M7) are quite expensive relative to other stocks (red dot)
  • Non-tech stocks are much more reasonably priced (black dot)
  • Interest rates affect what people think the “fair value”, or reasonable price, should be for stocks (dotted line thru the blue dots)

A few additional notes on the above chart:

    1. About the P/E: S&P 500 12-month Forward Price / Earnings Multiple (vertical axis): The Price / Earnings Multiple (P/E) is one standard metric used by analysts when trying to determine the relative value of a stock. It is the price paid for each $1 of earnings. Based on years of historical data, paying about $16 per share for each dollar per share of earnings a company produces is viewed as a reasonable price, or fair value.
    2. About Fair Value: The idea of fair value, or the reasonable price to pay for stocks, depends upon what part of the market you’re looking at. Faster-growing segments, like technology, command a premium to slower-growing areas, like utilities. Fair value also moves around as interest rates change.
    3. Interest Rates & Stock Prices: Last year, when interest rates were 2%, the P/E for the S&P 500 Index was around 18. Today, with interest rates at 5%, the fair value P/E is about 15, and the market trades at 19. This valuation metric says the stock market has some room to fall, given the current level of interest rates.
    4. Magnificent 7:The P/E for the M7, at 28, is very high relative to the rest of the stock market, so theoretically there’s a lot of room for these seven stocks to fall.
    5. Non-Magnificent 493:The P/E for the remaining 493 stocks in the S&P 500, at 16, is much closer to fair value, and therefore today is viewed as much more reasonably priced.
    6. About the Data: Scatter plot uses 20 years of monthly data (from 2003 – 2023)

For investors who have diversified stock allocations – including significant weights to non-technology stocks, small company stocks, and foreign stocks – portfolio performance in 2023 will likely be underwhelming when compared to a benchmark like the S&P 500, or high-fliers like the M7.

While this may be perceived as disappointing, keep in mind that segments of the market fall in and out of favor over time.

Viewed through another lens, stock price declines can present opportunities. Famed stock picker and Newton, MA native Peter Lynch, said in a recent Barrons’s interview: “I love it when stocks go down.”

The bottom line for stock-market investors: the best way to avoid the market-timing pitfall (and the outsized ups and downs that come with it) and enjoy the benefits of long-term, risk-controlled compounding, is to be well-diversified.

What happens in the near term to an individual stock or concentrated group of stocks can be noteworthy and interesting.

But what matters more for your financial wellbeing is how stocks can contribute to your diversified portfolio and your broader financial plan over the long term.

Bonds: 5% is the New 2%

A mere 22 months ago, all Treasury bonds were yielding 2% or less (most much less). The one-year Treasury note yielded about 0.5%. Today, it yields 5.5%. But talking in percentage points can be abstract.

What does the big move in interest rates mean for folks who invest in bonds?

There are two main pieces of the bond puzzle for investors to think about: income and price. Providing concrete examples might be helpful in putting the effects of interest rate increases into perspective.

The Price Piece

You may have a general understanding of the price / yield relationship when it comes to bonds.

You can validate that interest rates have been going up by checking out what’s on offer at your local bank: savings accounts and CDs pay more today, and mortgages cost a lot more.

If you hold individual bonds, or a typical bond fund in your brokerage account or IRA, you’ve probably noticed that the prices are lower today when compared to last month or last year.

The reason is this: as new bonds are issued at current interest rates (which are higher than in the recent past), old bonds, which pay a fixed rate of interest through their coupons, must adjust.

The adjustment mechanism is the price of the bond (or bond fund). The price of old bonds will fall to a level that makes their yield comparable to the yield offered by new bonds.

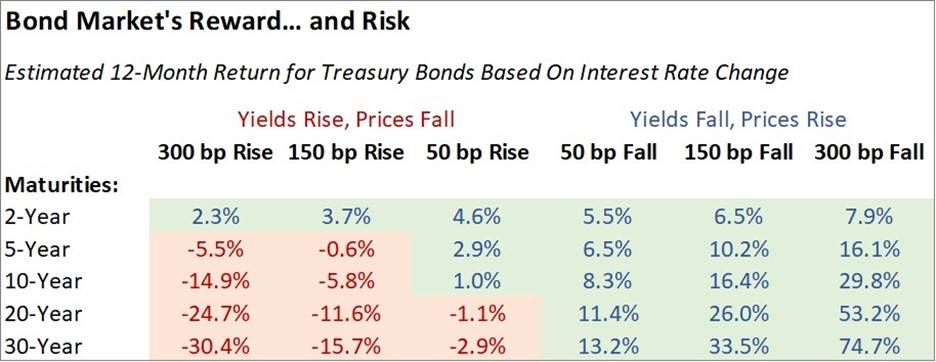
The table below shows how bonds are expected to perform over the course of the next year given various scenarios for changes in interest rates.

Note that bp is ‘basis point’, or 1/100 of a percent. A 300-basis point fall (last column) is a three percentage point decrease from the current level of interest rates. As interest rates fall, bond returns go up. As rates rise, bond returns go down.

One takeaway from the table is that for holders of high-quality short-term bonds (like US Treasuries) it is now difficult to envision an environment where returns for the next 12 months could be negative.

Even if Treasury bond interest rates were to climb to 8% (from today’s 5%), the 12-month return would still be positive for holders of short-maturity bonds. This is because: 1. Short-term bond prices are less sensitive to interest rate movements; and 2. Income from coupon payments more than offsets the negative price adjustment.

For holders of longer-maturity bonds, an interest rate decline would translate to big gains.

But interest rate risk cuts both ways. If rates were to climb by another 1.5 percentage points or more during the next year, it would mean additional losses for holders of intermediate and long-maturity bonds.

The pain for current bond holders has occurred as prices have fallen to adjust to higher interest rates. But the good news is that higher interest rates offer protection against future interest rate increases and price declines. And higher interest rates mean more yield, and therefore more income.

The Income Piece

The pleasure related to bonds is that investors now can reinvest at higher interest rates (compared to the recent past) and therefore earn more money over time.

To put this into perspective, if you invested $100,000 into the 1-Year Treasury in January 2022, you would have collected $500 in interest by the time the bond matured one year later.

Today, if you purchase a one-year Treasury note, you’ll earn about 5.5% in interest, which, on a $100,000 investment, translates to earnings of $5,500. In the span of just under two years, the expected return on short-term Treasuries has increased 11-fold.

This income component of bonds is the straightforward part of the bond puzzle.

The Whole Puzzle

The tough part is that investors holding bonds as part of a balanced portfolio have experienced losses as interest rates climbed. This has unquestionably been painful.

The good news is that you can expect to receive a lot more income from your bond investments, and this income helps to mitigate the downside of interest rate risk.

The bottom line for bond investors: taking some degree of interest rate risk is reasonable for most investors, most of the time. The amount of risk each individual investor should take depends upon their personal circumstances and market conditions.

At this point, given current market conditions, a prudent approach is to err on the side of caution.

Today, one-year Treasury notes yield about 5.5%, and 10-Year Treasuries yield 4.9%. Though the yields are close, the interest rate risk is very different. Some of the better deals, and higher yields, are currently in short-term bonds.

Investors get paid to wait and see how the inflation environment, and the interest rate environment, will unfold in the months ahead.

RK


Interest Rate Football

The Olympics captures our imagination. It is built on dreams, wrapped in narrative, fueled by drama, and played on the world’s athletic stage. If we were to draw an analogy to the financial world, the Olympics lines up well with the stock market. It holds the promise of the thrill of victory, and at times delivers the agony of defeat.

Football, on the other hand, demands our attention. It is persistent, visceral, and woven into the fabric of American society. Extending the financial analogy, football is akin to interest rates and the bond market. You might fully engage, casually observe, be perplexed or uninterested, but it’s difficult to completely ignore.

The owners of the thirty two NFL teams set the rules of the game. Similar to the football team owners, the twelve members of the Federal Reserve’s Federal Open Market Committee (FOMC) set interest rate policies that affect the level of interest rates and influence bond returns.

The FOMC is now suggesting that policy may soon shift from ‘hike’ to ‘hold’. If this is the case, short-term interest rates, which are currently at 5.5% and which have been on an upward path since 2021, could stabilize in the near future.

The managers of large bond mutual funds and ETFs function like NFL coaches. They call the shots for their respective funds (teams) and decide which bonds (players) to hold and which to trade.

Several large fund managers have been encouraging financial advisors to add longer-term bonds and bond funds to their clients’ portfolios.

Vanguard, the well-known firm in Pennsylvania, claims “opportunities in bonds abound”, and “now is the time to add high-quality bond exposure.” PIMCO, the California-based bond specialist, proclaims “Bonds are back” and recommends investors “make the most of this compelling opportunity”.

And the world’s largest asset manager, New York based BlackRock says “the Fed should be done” and it’s Chief Investment Officer for Fixed Income says “You can put your shoulder behind a bit more of interest rate (bond) exposure.”

The bond fund managers are making strong statements, with conviction, and backed by experience. But like NFL coaches who are advocates for their teams, these bond fund managers are prone to offer positive prognostications for their funds.

My bias is to proceed with skepticism and caution regarding the “opportunities” offered by intermediate- and long-term bond funds. Why?

  • Interest rate cycles tend to unfold over years, rather than weeks or months
  • Bond rates are still adjusting from all-time Pandemic-era lows
  • Bonds with the shortest maturities, and lowest risk, today offer the highest yields

The picture below, courtesy of JP Morgan Asset Management, is one that I’ve shared with you previously. When thinking about interest rate risk in client portfolios, I keep this image at the forefront of my mind.

The blue line in the chart displays the nominal yield of the 10-year Treasury bond over time. Today’s 10-Year Treasury bond pays just over 4% annually. Although the yield is significantly higher than what was on offer during the early days of the pandemic, it sits well below the long-term average yield of 5.76%.

And with inflation still above 4%, currently there is no inflation-adjusted compensation being offered by longer-term Treasury bonds. The grey line, depicting inflation-adjusted ‘real yields’, shows this.

The risk for bond investors who take on more intermediate- and long-term bond exposure is that interest rates continue on an upward path.

For example, if 10-year interest rates were to move higher by another 1 percentage point, to 5%, this would translate to a price decline of about 8% for 10-year Treasury bonds. The bond holder (or bond fund holder) would still receive interest over time, but the bond price would need to fall to make up for the jump in interest rates.

The bottom line: play bond defense. The interest rate environment remains unsettled. Shorter-term bonds and shorter-term bond funds are a safer option when inflation is elevated and interest rates are trending higher. Today, investors get more yield by taking less interest rate risk.

The adage “the best defense is a good offense” is attributed to George Washington and often repeated by football commentators. Sometimes, though, the best defense is simply achieved by playing defense.


Measuring the Market

By any measure, stock market performance has been pleasing so far in 2023. Large company US stocks have gained about 17.5% as of August 10.

Is 2023 performance too good to be true? Should you be making moves in your portfolio, to prepare for the next, inevitable downturn? After all, some prognosticators claim we’re now “due for a correction” (or worse).

Rather than trying to figure out what will happen next week, next month, or next year, I believe it’s more constructive to view financial markets through a longer-term lens.

Consider the past five years of returns: 2022, when stocks fell 18%, was terrible. Which was preceded by three wonderful performance years: 2021, 2020 (despite the pandemic), and 2019 (+29%, +18%, and +31%, respectively). But stocks struggled in 2018, falling by 4.5%.

The five-year look back on large company US stocks (average annual return) as of August 10, was 11.2%. And the very long term? Large company US stocks returned 11.5% per year, on average, over the previous 94 years.

Bonds, as you might expect, have not only failed to keep pace with stocks (as is usually the case) but have experienced a protracted slump after a period of very low yields, followed by a big jump in interest rates.

The 5-year average annual return for US investment-grade bonds as of August 10 was a paltry 0.6%. Longer term, bonds have returned about 5% on average per year since 1928.

While you’re unlikely to get the long-term average annual return over any one specific 12-month period, the odds of receiving a positive outcome by holding a well-diversified portfolio are stacked in your favor.

The chart below depicts annual returns of a portfolio allocated 60% to stocks and 40% to bonds, going back to 1926 (courtesy of Vanguard). Annual returns are slotted into one of seven buckets, ranging from -20% or worse to +30% or better.

The key take-aways from the chart, regarding 60% stock / 40% bond portfolios are:

  • Annual returns have landed most frequently in the +10% to +20% bucket
  • More than half the time annual returns have exceeded 10%
  • It is rare for a balanced portfolio to experience a year like 2022 (black block) and land in the -10% to -20% bucket
  • If you set your expectations for the long-term annual return from a well-diversified portfolio somewhere in the mid-single digits, you’re unlikely to be disappointed

Americans Love American Stocks

American investors seem to prefer to hold stocks of American companies over shares of companies that are based elsewhere in the world.

According to a recent article in The Economist magazine, American fund investors hold just a sixth of their equity allocation in funds that invest in non-US companies.

Compare this to the composition of the global stock market, where nearly 40% of the total value of the global stocks reside in companies that are headquartered outside of the United States.

Are investors who eschew foreign stocks on to something?

During the past fifteen years, stock allocations heavily weighted to US shares have outperformed more balanced US / foreign stock allocations.

In the chart below, from JP Morgan Asset Management, the grey areas indicate US stock market outperformance.

But US-only stock fans should beware the purple!

Shares from non-US companies (EAFE stands for Europe, Australasia, and the Far East) have outperformed US shares for meaningful stretches in the past, as the purple sections of the chart above shows.

Researchers at AQR, a US-based investment firm, published an article in the June edition of the Journal of Portfolio Management which argues that, despite the current lengthy period of lagging US stocks, the case for international diversification remains strong.

A key point in the AQR article is that US stocks have gotten much pricier than shares of foreign companies (using time-tested means of valuing stocks), so investors are likely to be rewarded in the future by ensuring that their stock allocation contains shares of foreign companies.

Picking the ‘right time’ to buy or add exposure to any asset class is a difficult game.

But JP Morgan’s and AQR’s research make a strong case that a stock allocation incorporating a healthy portion of non-US stocks is likely to be good for your portfolio in the years ahead.

Should Investors Fear Recession?

Global Pandemic, Supply-Chain Breakdown, War in Europe, Inflation Flare Up, Crypto Crash, Bank Collapses, and US Debt Ceiling Debacle. A lot has been thrown at the financial markets, and at investors, during the past three years.

Stock and bond markets buckled in 2022, but eventually stabilized. So far this year, the tone and direction of the financial markets has generally been constructive. And investors have remained resilient.

As we look toward the back half of 2023, a main concern is: will the economy fall into a recession?

Some prognosticators are convinced that recession is the next shoe to drop, and that an economic downturn will lay the financial markets low once again.

David Rosenberg, a prominent Wall Street economist who currently runs his own research shop, is one of the economic bears.

In Rosenberg’s assessment, the odds of a deep recession starting in 2023 are 99%, and the stock market is likely to decline by 30%.

Morgan Stanley’s chief US equity strategist, Mike Wilson, is another naysayer.

In Wilson’s view, lots of economic uncertainty and over-optimism regarding corporate profit growth (meaning companies’ results are likely to disappoint in the quarters ahead) are cause for pessimism. He sees stock price declines ahead.

Billionaire hedge fund founder Cliff Asness, of AQR Capital Management, sees the possibility of a recession that “wouldn’t be mild” and concludes that stocks “are a scary place” to be.

These are smart and successful people (at least by Wall Street standards), so should we heed their warnings and steer clear of stocks? Or at least own fewer of them, if we believe a recession is nigh?

Implied in that question is the assumption that stock prices fall when a recession hits. So, is this true?

The answer is: sometimes, but not always. More accurately, the answer is: recessions have coincided with stock price declines half the time.

Researchers at Renaissance Investment Management have dug deep into the data and have concluded: timing your stock market exposure around a recession is harder than you might think.

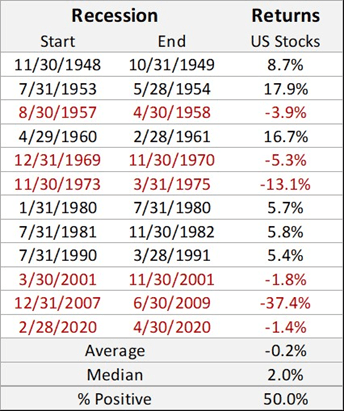
The table below, from Renaissance, shows the twelve recessions that occurred in the post-World War II era along with US stock market performance during the recessions.

Interestingly, the stock market rose in six of the twelve observances of economic contraction.

So even with perfect economic foresight at the start and end of a recession, selling stocks at the beginning of a recession and buying them back at the end would have resulted in being better off (by preserving capital) only half the time.

In the other half, the investor with prescience regarding economic events would have foregone stock market gains.

The historical record is worth knowing, especially if you’re prone to worrying about your portfolio when the economy slows down. One interpretation is that market timing can work – if you’re lucky.

But a better approach for long-term investment success (and one that doesn’t require luck to yield satisfactory results) is determining an appropriate asset allocation plan for your individual circumstances – and sticking to it.

AI, AI, Oh! – Enthusiasm for Artificial Intelligence Abounds

The stock market gains so far in 2023 have been pleasing, with the S&P 500 index of large-company US stocks gaining 9.7% through the end of May and advancing further during the early days of June.

Investor enthusiasm about the potential benefits to companies from Artificial Intelligence (AI) has been the main driver recently of the S&P 500’s gain.

According to research from Goldman Sachs, the seven largest technology-company constituents in the index – Apple, Microsoft, Alphabet (owner of Google), Amazon, Nvidia, Tesla, and Meta (owner of Facebook) currently make up about 27% of the S&P 500 index. These ‘tech seven’ have surged 53%, compared with a net zero gain for the remaining 493 stocks.

While this very sizable outperformance of just a few stocks may be unusual, a wide divergence in performance among sectors of the market is typical from year to year. Also, market leadership tends to rotate on a sector basis over time.

While many investors find it helpful to have some perspective on evolving market trends, it’s important to keep in mind that a diversified portfolio is a time-tested way to participate in the positive market trends of today, and limit downside when the market leaders of the moment eventually fall out of favor.

From TINA to BANANA: The Benefits of Higher Bond Yields

On Wednesday, May 3, the Federal Reserve delivered the 10th interest rate hike since beginning its fight against inflation in earnest in March 2022. The latest action pushed the Fed Funds short-term interest rate above 5% for the first time in 15 years.

In his press conference following the rate hike announcement, Fed Chair Jerome Powell indicated that he expects the economy to slow down and inflation to continue to decline in 2023.

This implies that the Fed likely will be able to take a break from boosting short-term interest rates soon, and that we may be in for an extended period of Fed inaction.

In this note I share some perspective on what a pause after a period of interest rate increases means for investors holding bonds and bond funds.

In the months and quarters following the pandemic, Wall Street people often used the acronym TINA (There Is No Alternative) when referring to stocks.

After interest rates dropped to the floor in 2020, and stayed there for some time, bonds offered little by way of returns, while many stocks and stock funds paid dividends and appreciated in price, especially in 2020 and 2021.

In 2022, the financial markets turned from TINA to TONR (There’s Only Negative Return) as investors suffered through high inflation, rising interest rates, and stock and bond bear markets.

However, the change in the interest rate environment, which started in 2021 and accelerated in 2022, brought a benefit, by way of higher yields, that improves the long-term outlook for bond fund holders.

In 2023, we’ve got BANANA – Bonds Are Now A Nice Alternative. In some cases, bonds and bond funds now present compelling yields with satisfactory total return potential.

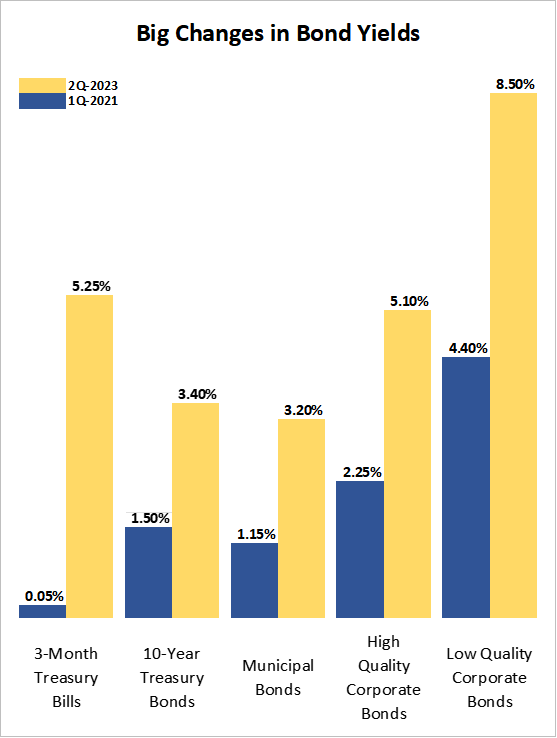
The chart below compares where yields were for different types of bonds two years ago (in early March 2021) with where yields are today, following a period of inflation-fighting by the Federal Reserve.

The sharp yield increase resulted in a steep decline in bond prices in 2022. What does this mean for investors going forward?

DoubleLine, the bond fund manager, has done some research on this topic. Their analysis shows that the prospects for positive returns from bond fund holdings, in years following sharp yield rises (and corresponding price drops) is quite good.

The average price of bonds in the Bloomberg US Aggregate Bond Index (a broad measure of High Quality Corporate and Government bonds) going back to its inception in 1977 is $100. Today, the average price is in the low $90s.

According to DoubleLine, investing in High Quality bonds when the average price of the index is between $90 – $100 has typically meant returns of between 5% – 10% during the next 12 months. In years following sharp yield increases, bond returns historically have been positive.

While 2022 was painful for bond fund holders, the next several years (assuming the average bond price remains below $100) may be more pleasurable for investors who have significant bond allocations in their portfolios.


How Custodial Service Providers Keep Your Assets Safe

As the bank tempest was hitting full force in March, a few clients did reach out to me to inquire about how the money that we manage for them is kept safe. Below is a summary.

Client assets managed by Moore Financial Advisors are typically custodied at Pershing LLC, and Shareholders Service Group is a broker that also acts in an administrative capacity for client accounts.

Client assets are kept safe through the following:

  • Segregation of Assets: client assets are segregated from Pershing’s (custodian) and Shareholders Service Group’s (broker) assets. Unlike with checking and savings accounts at your bank, which are obligations of the bank, the assets in brokerage accounts, Trusts, and IRAs are legally separate from the assets of the custodian and broker that oversee them on clients’ behalf
  • Financial Strength: Pershing is part of BNY Mellon. The stand-alone financial strength of BNY Mellon is high. Two of the major credit rating agencies, Moody’s and Standard and Poor’s, assign a “AA” credit rating to BNY Mellon. (The highest ratings tier is AAA.)
  • FDIC Insurance: uninvested cash in client accounts is typically held in the Dreyfus Insured Deposits program. Dreyfus is a subsidiary of BNY Mellon. Dreyfus Insured Deposits benefit from the $250,000 Federal Deposit Insurance Corporation (FDIC) guarantee.
  • SIPC Insurance: Investments in Pershing accounts are protected by Securities Investor Protection Corporation (SIPC) coverage of up to $500,000. Pershing also provides coverage in excess of SIPC limits from commercial insurers.
  • About SIPC Insurance: this covers investors if Pershing were to fail and client assets cannot be located due to theft, misplacement, or destruction.

If you have additional questions regarding the safe-keeping of your assets, please send a message to Susan or me and we’ll gladly address your inquires.