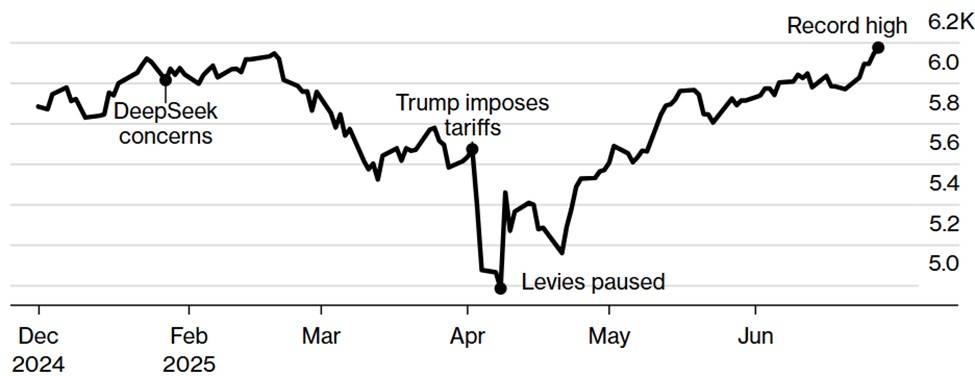
November started out looking like a month not to remember, as the government shutdown continued, concerns mounted about the Federal Reserve backing away from interest rate reductions, technology stocks sank, and crypto prices cratered.
By mid-month asset price declines were mounting: US large company stocks were down by 4%; technology stocks had fallen by 9%; and Bitcoin had dropped by 23%.
However, the mood in the market became more positive as the month lengthened, perhaps helped by a holiday hiatus and the arrival of year-ahead forecasting season.
Wall Street research departments are delivering their best guesses for what might happen in the next twelve months. And many forecasters look for another year of double-digit returns for stocks in 2026.
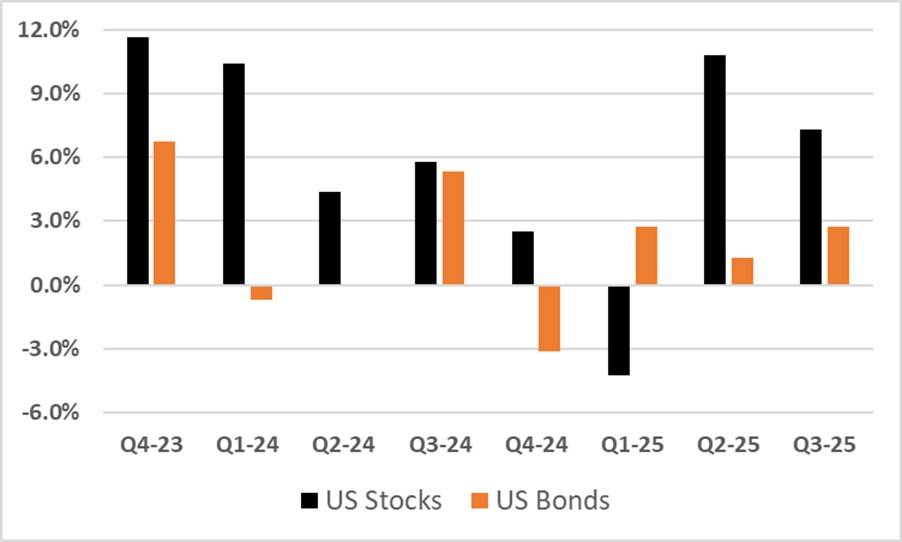
By the time November drew to a close, many asset classes had posted modestly positive returns.
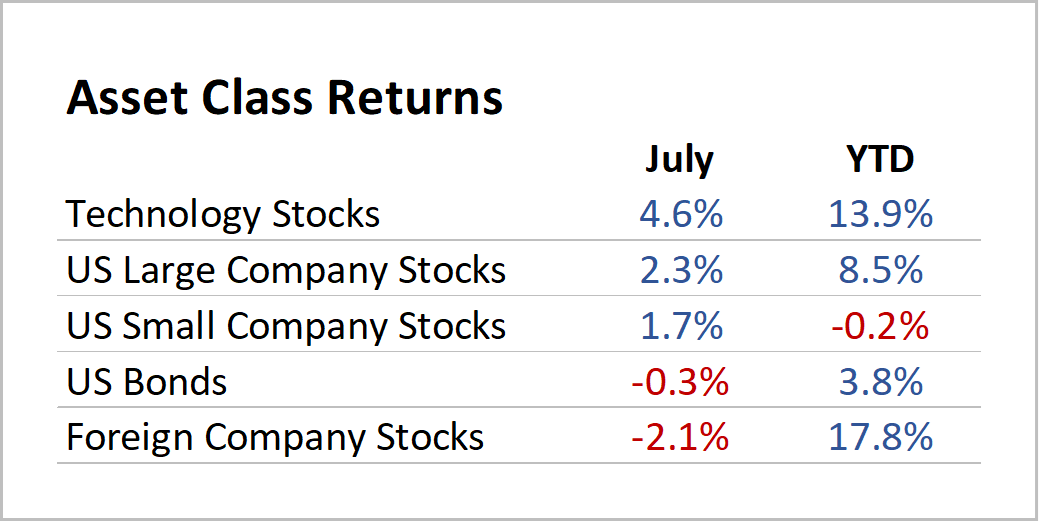
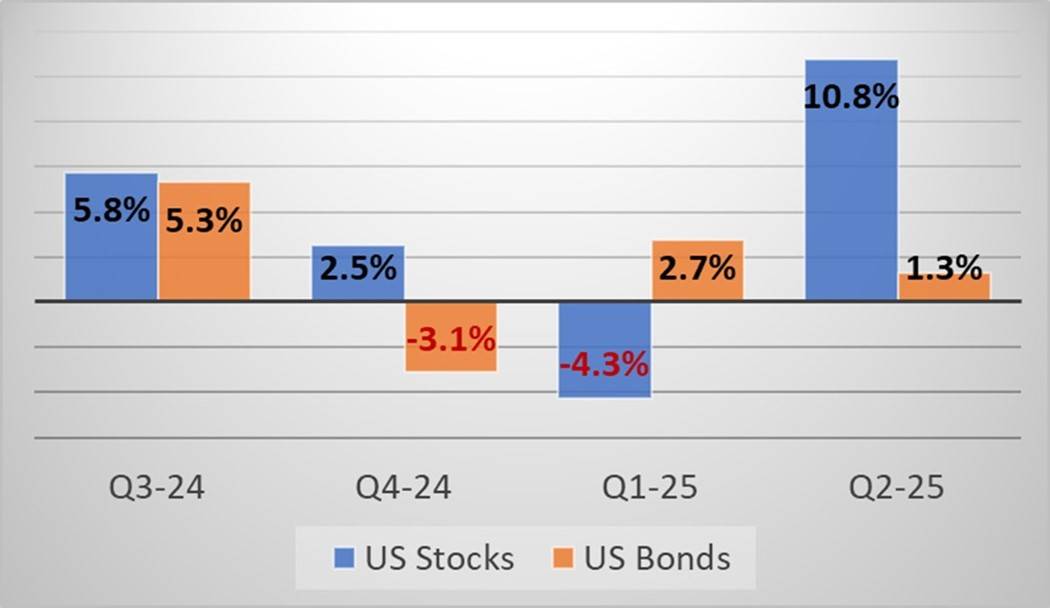
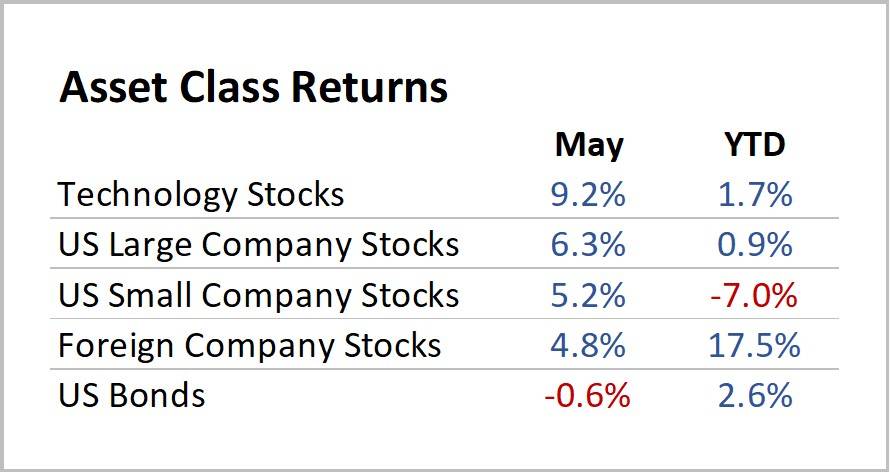
Here’s a snapshot of financial market performance for the month of November and Year-to-Date (YTD):

I am text block. Click edit button to change this text. Lorem ipsum dolor sit amet, consectetur adipiscing elit. Ut elit tellus, luctus nec ullamcorper mattis, pulvinar dapibus leo.
Source: Moore Financial Advisors & Morningstar
Clichés for Investing
I love a good cliché. So, let’s not beat around the bush. Let’s bite the bullet, cut to the chase, and talk turkey: some investors are really worried that we’re in the calm before the storm.
In conversations with clients during the past month, I’ve detected a higher than usual level of anxiety.
Perceived pernicious policy priorities pursued by the current administration, along with highly polarized politics and debased social dialogue are amping up concerns about what comes next.
The propensity to extrapolate is natural. If part of the picture (political-social) seems out of focus or out of whack, shouldn’t that eventually affect other parts (economic-financial) of the landscape? Possibly, but also neither necessarily nor probably.
But looking at the horizon through economic and financial market lenses, the outlook appears to be fairly constructive as we approach 2026.
For inveterate worrywarts (a group of which I am a card-carrying member), here are some recent economic and financial observations to keep in mind:
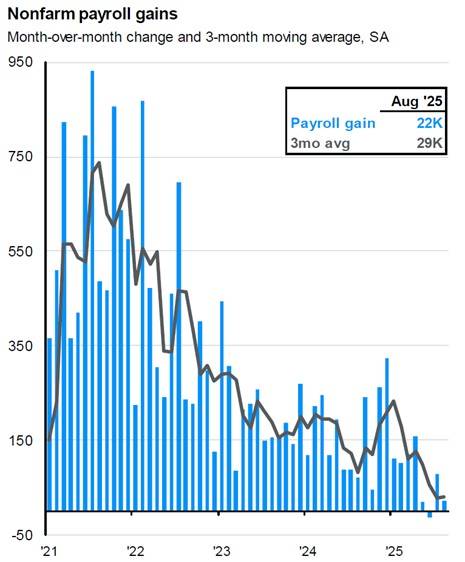
- Jobs: the labor market is healthy; the Department of Labor’s weekly jobless claims data signals a labor market that is neither cracking or overheating; some economists describe the current situation as “no-fire, no-hire” and “softer”, which, though different from the exceptionally strong demand for labor situation after the pandemic, still remains supportive for the economy
- Income: wage gains for workers are expected to continue in 2026 according to surveys conducted by groups like Payscale and Mercer, likely in the range of 3.0% – 3.5%, down slightly from 2025 (but outpacing inflation); Goldman Sachs expects real disposable personal income (a broader measure of spending power than wage gains) to grow more than 4% in 2026
- Loan Delinquencies: about 5% of the US population is experiencing third-party collections (being pursued by an independent agency to recover overdue debts) which quite low by historical standards and an indication of consumer health
- Trade: the US-led trade war started in March and accelerated in April; but trade deals were signed with different countries over the summer and into the fall, stabilizing trade relationships and improving prospects for economic growth
- Demand: a recent study by the San Francisco Fed shows that strong economic activity and strong demand for goods and services accounts for the majority of price growth in the economy; this is an improvement over the post-pandemic situation, where inflation was primarily a function of supply chain issues and supply shocks
- Taxes: The nonpartisan Congressional Budget Office estimates that changes in tax law are likely to boost economic growth by nearly one percentage point in 2026.
- Profitability: US companies, in aggregate, remain very profitable; in Q3-2025, large US companies grew earnings by 12% compared to a year ago; the delayed impact of lower interest rates will be supportive for company profits in 2026; and high profitability is generally supportive of stock prices
Regarding investments, many asset prices are unquestionably high. We’ve experienced three strong years of stock market returns: 26% in 2023, 25% in 2024, and 18% year-to-date in 2025.
While lofty stock market levels present some potential vulnerability for portfolios, it’s important to keep in mind that pullbacks and corrections are a normal part of investing.
In Q1 2023, stocks dropped by 9%. From mid-July to mid-August 2024, stocks declined by 8.5%. In 2025, stocks hit a new all-time high in February and then proceeded to fall 19% by early April.
Crises that lead to deep bear markets and long-term asset impairments thankfully occur once in a blue moon.
Part of my approach as a financial advisor is to keep my ear to the ground for behavior, developments, and situations that may sow the seeds of the next crisis.
There are a few situations that I am keeping my eye on, including:
- outsized borrowing by giant technology companies to fund AI-related investments
- the push by large investment firms to “democratize” access to private investments
- recent appearance of fraudulent activity (including at Tricolor and First Brands) that have resulted in sizable corporate bankruptcies
But for now, investors likely will be well-served to continue to go with the flow, and there is a reasonably good chance that in December 2026 we’ll be able to say, “all’s well that ends well”.