Category

Medicare: Reviewing Your Options After Age 65

Each year from mid-October through early December, Medicare enrollees have a window to make changes to their coverage. This article provides a guide for reviewing your Medicare and supplemental coverage.

At the end of this article, we provide a helpful “Should I Change My Medicare Coverage?” flowchart which you can download.

For plan year 2026, the Annual Open Enrollment Period (AEP) runs October 15 through December 7.

During this time, you can:

  • Switch from Original Medicare + Part D to a Medicare Advantage plan
  • Switch from one Medicare Advantage plan to another
  • Drop Medicare Advantage and go back to Original Medicare (although in most states – except MA, CT, ME, and NY – Medigap insurers are not required to sell you a policy after your first year on Medicare if you don’t meet the medical underwriting requirements)
  • Enroll in or change a Part D (prescription drug) plan

If you already have Medicare, this is your annual chance to reassess whether your coverage still meets your needs.

What Original Medicare Enrollees Should Review 

If you are enrolled in Original Medicare (Parts A & B), here’s what your annual review should focus on:

Part D Drug Coverage

  • Setting up and reviewing your account at www.medicare.gov can be very helpful in comparing plans.
  • Are your current medications still covered?
  • Do the copays, coinsurances, and coverage tiers change for next year?
  • Is your preferred pharmacy network still included?

Medigap / Supplement Policy Changes 

  • Some insurers may raise premiums or adjust rate classes.
  • In most states (except MA, CT, ME, and NY,) once your Medigap enrollment period is over, you may not be able to switch without medical underwriting, so changes are harder later.
  • If your plan offers rate “community-rated” options or age-based rates, check how your premium may change.

Part B / Cost Increases & IRMAA 

  • Expect the standard Part B monthly premium to rise to approximately $206.50 in 2026; higher-income beneficiaries may face steeper surcharges (in Medicare-speak, IRMAA: Income-Related Monthly Adjustment Amount)
  • Also review the Part B deductible and coinsurance changes in your 2026 “Medicare & You” handbook.

Providers & Networks 

  • Even though Original Medicare generally allows you to see any provider who accepts Medicare, certain supplemental or supplemental plan services (e.g. preventive benefits) may change coverage rules.
  • Ensure your preferred physicians and hospitals still accept Medicare under the same terms.

Total Cost Projection

Your Medicare.gov account can help you:

  • Add up your premiums (Parts B, Part D, Medigap) + estimated out-of-pocket (copays, deductibles) + travel/foreign care exposure.
  • Compare competing Part D or Medigap policies in your area for cost savings.

What Medicare Advantage Enrollees Should Review 

If you currently have a Medicare Advantage (MA / Part C) plan, here’s a checklist:

Annual Notice of Change (ANOC) & Evidence of Coverage (EOC) 

  • These notices typically arrive in September. They list changes in premiums, drug formularies, cost sharing, provider networks, and benefits.
  • Review them carefully. If your plan’s changes make it worse for you (higher costs, your doctors dropped, drugs removed), consider switching.

Doctor / Hospital Network 

  • Confirm that your preferred providers remain in-network under the plan for 2026.
  • If your doctors shift networks, your costs could increase substantially.

Drug Coverage / Formulary Changes 

  • Some drugs may be removed, moved to higher tiers (more costly), or require step therapy or prior authorization.
  • Check whether your current pharmacy is still a “preferred” or in-network pharmacy.

Premiums, Deductibles, and Maximum Out-of-Pocket

  • Even if your monthly premium stays low, changes elsewhere (higher outpatient copays, specialist costs, or hospital deductibles) can change your financial outcome.
  • Also watch for plan design changes (e.g. shifting benefits to coinsurance vs fixed copays).

Supplemental / Extra Benefits 

  • Many Medicare Advantage plans include extras (dental, vision, hearing, wellness, transportation). However, insurers are under budget pressure and may reduce or eliminate some supplemental benefits.
  • Verify whether extras that matter to you remain part of the plan.

What’s Changing in 2026 (What to Watch For) 

Looking ahead to plan year 2026 for Medicare, here are some of the major shifts and pressures to be aware of:

Insurer Exits / Plan Reductions

  • Several major carriers (Aetna, Elevance, UnitedHealthcare) are scaling back their Medicare Advantage or prescription drug plan presence in some markets.
  • When a plan you’re enrolled in is discontinued, you’ll get a Special Enrollment Period (SEP) to choose a new plan. Some states also allow guaranteed issue rights to enroll in Medigap in that scenario.
  • This website is one way to search for a new plan: medicareresources.org

Changes to Drug Pricing and Part D 

  • The Inflation Reduction Act allows Medicare to negotiate certain prices for certain high-cost prescription drugs (Eliquis, Enbrel, Entresto, Farxiga, Imbruvica, Januvia, Jardiance, Flasp/Novolog, Stelara, Xarelto) starting in 2026.
  • The out-of-pocket cap for Part D will increase (e.g., from $2,000 to $2,100) in 2026.
  • Some insurers may face lower federal subsidy support, leading to premium increases or tighter formularies.

Premium Changes 

  • While average MA plan premiums are expected to decline (or remain stable) in many areas, other costs may still rise (Part B premium increases, drug or service cost sharing).
  • Part B premium increases are expected; some sources project it could reach ~$206.50 in 2026 (though that’s not yet final).

Benefit Reductions & Tighter Coverage

  • Some insurers may reduce supplemental benefits (transportation, over-the-counter allowances, meal delivery) to preserve margins.
  • Expect more restrictive prior authorization or utilization management in some plans.

You can find more information through this link: 10 Major Medicare Changes Coming in 2026

Tips for Choosing Wisely During Open Enrollment

  • Start early — don’t wait until December. Review your ANOC/EOC as soon as you receive them.
  • Use the Medicare Plan Finder at www.medicare.gov to compare all available plans in your ZIP code, using your actual drug list and preferred providers.
  • Contact your State Health Insurance Assistance Program (SHIP) — free local counseling. In Massachusetts, this program is known as SHINE.
  • Create a short “must-have list” for coverage (e.g. your physicians’ network, essential drugs, maximum acceptable cost increases) and screen plans against that list.
  • Don’t just look at the monthly premium — total cost matters: premiums + cost sharing (copays, coinsurance, deductibles) + network adequacy.
  • If your current plan is being discontinued, act quickly in the Open Enrollment period to select a new plan before coverage gaps arise.
  • Document all your enrollment decisions, take screenshots, or save confirmation numbers — mistakes happen.

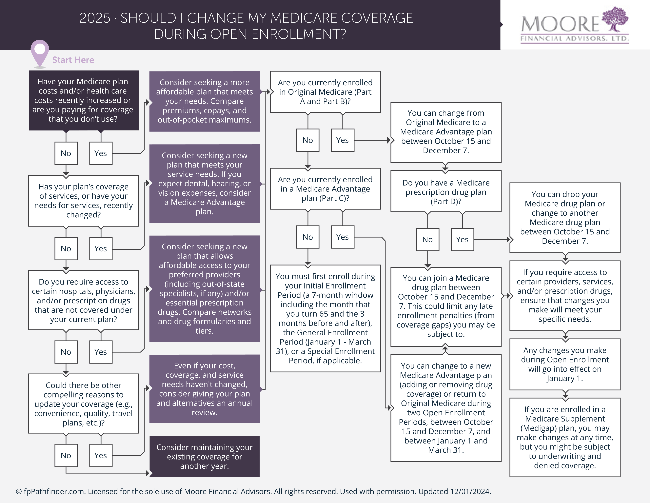
The flowchart below is a guide that helps you determine if you should change your Medicare coverage during open enrollment. Click on the image to download or print the chart.

-SM

Medicare: Preparing to Enroll at Age 65

If you’re approaching 65, now is the perfect time to understand the Medicare rules and options so you don’t miss important deadlines. This article walks you through what you need to know as you prepare to enroll.

At the end of this article, we provide an “Am I Eligible for Medicare?” flowchart which you can download.

Who Needs to Sign Up for Medicare? 

  • Most people become eligible for Medicare at age 65.
  • If you are retired and not covered by an employer health plan, you’ll need to enroll in both Medicare Part A (hospital coverage) and Part B (medical/outpatient coverage) during your initial enrollment window.
  • If you are still working at age 65, you should enroll in premium-free Medicare Part A while you have employer coverage, as it won’t affect your job-based insurance and can offer secondary coverage without a penalty.
  • If you are 65, working, and covered by your (or your spouse’s) large employer health plan (20+ employees), you can delay Part B without penalty until you leave that employer coverage. You’ll have a Special Enrollment Period (SEP) for Part B that lasts until 8 months after your or your spouse’s employment or employer coverage ends.
  • If your employer is smaller (fewer than 20 employees), Medicare generally becomes your primary insurance at 65, and you’ll need to sign up for both Medicare A and B to avoid gaps in coverage.

When Should You Sign Up? 

  • Your initial enrollment period is a 7-month window around your 65th birthday: the three months before your 65th birthday, the month of your birthday, and the three months after.
  • Signing up before your birthday month ensures coverage starts as soon as you’re eligible.
  • If you delay and don’t have other qualifying coverage, you may face late enrollment penalties that last for life. 

What Will Medicare Cost in 2026?

  • Part A (Hospital Insurance): Generally premium-free if you or your spouse worked 10+ years.
  • Part B (Medical Insurance): The standard premium is projected to be $206.50/month in 2026 (up 11% from the 2025 premium of $185/month.)
  • Higher-income households may pay more due to IRMAA surcharges. With rising healthcare costs, it’s wise to budget for increases over time.

Original Medicare vs. Medicare Advantage 

Medicare Parts A (hospital) & B (outpatient) generally cover about 80% of health care charges in these two categories of care. Most people buy additional insurance to cover the remaining costs of care.

You will need to make a choice between two ways to get benefits to supplement Medicare A & B when you sign up. Below are more details on the two categories of Medicare.

Original Medicare

Original Medicare with a Medigap (supplement) policy offers the widest choice of doctors and hospitals since you can see any provider nationwide who accepts Medicare.

It works especially well if you travel frequently, are a “snowbird”, or want the flexibility to see specialists without referrals.

Pairing Original Medicare with a Medigap policy can help cover deductibles, coinsurance, and copays, giving more predictable out-of-pocket costs.

Most people also need to buy a separate Part D prescription plan, and total monthly premiums (Medicare + Medigap + Part D) can be higher than Medicare Advantage.

Medicare Advantage

Medicare Advantage plans, offered by private insurers, often bundle hospital, medical, and prescription coverage into one plan.

Many include extras like dental, vision, or gym memberships, and premiums can be lower than Original Medicare with a supplement.

However, Advantage plans typically use provider networks (HMO or PPO), which may limit your choice of doctors and hospitals.

Out-of-pocket costs can be less predictable because of deductibles, copays, and coinsurance, especially if you need specialized or out-of-network care.

There’s no one “best” option—it depends on your health, budget, and provider preferences.

Where to Get Help

  • www.medicare.gov – The official Medicare website with enrollment and plan comparison tools. You can compare costs and coverage in your area for Medigap and for Medicare Advantage plans. If you set up your account and enter the drugs that you take, you can also compare the total cost of Part D insurers available to you.
  • SHIP (State Health Insurance Assistance Program): Free counseling in every state.
  • Generally, these services are available by calling your local senior center.
  • In Massachusetts, this is called SHINE (Serving the Health Insurance Needs of Everyone).
  • Your financial planner – We can help you evaluate Medicare choices in the context of your retirement income, taxes, and long-term health planning.

If you’re approaching age 65, don’t wait. Understanding when and how to enroll in Medicare—and what it will cost—can help you avoid penalties and find coverage that fits your needs.

The flowchart below is a guide that helps you determine if you’re eligible for Medicare Part A & Part B. Click on the image to download or print the chart.

-SM

September 2025 Market Recap: Good Times, Continued

September delivered another month of positive returns for investors:

  • Russell 2000 Index of small company stocks returned 5.5%
  • MSCI EAFE Index of foreign stocks returned 4.8%
  • S&P 500 Index of large company US stocks returned 4.2%
  • Bloomberg Aggregate Bond Index, the benchmark for US bonds, rose by 1.3%

US stocks reached new highs eight more times in September, bringing the tally in 2025 to twenty-eight new “all-time highs” for large company US stocks.

When viewed through a broader lens of the quarter (last three months):

  • US small company stocks were the top performer, returning 10.5%
  • US large company stock returns of 7.3% edged out foreign stock returns of 6.2%
  • Bonds delivered a more muted return of 2.8%

Widening the aperture further still, the chart below shows US financial market returns by quarter for the last two years.

Source: MFA & Morningstar

Large company US stock returns are shown in black, US bond returns are shown in orange.

This picture illustrates a pleasing run of positive performance: only one quarter in the past eight has been negative for stocks, with quarterly average stock performance at 6%.

Bonds haven’t fared as well, but still the outcome still has been constructive for investors. With two quarters of negative returns and one of essentially zero return, quarterly bond performance has averaged 2%.

One of the questions at the front of mind for many investors is: will the positive trends persist?

Here’s some historical perspective: according to research from Jessica Rabe at DataTrek (an independent research firm), the odds are greater for returns to reach their high point for the year in the 4th quarter when the stock market is having a good year.

DataTrek looked at annual returns each year since 1980 and catalogued the month in which the stock market peaked each year.

The table below shows stock market peaks by month; percent of time since 1980 that the stock market peaked for the year in that month; and average annual return when stock market peaked in a given month.

Source: DataTrek

Here are two key take-aways from DataTrek’s research:

  • the S&P 500 has tended to reach its high point for the year in December when returns for the full year were strongly positive (this happened in 24 of the 45 years since 1980, or 53% of the time – bottom of the chart)
  • the stock market has tended to reach its high point for the year in January when returns for the full year were strongly negative (5 times in 45 years, or 11% of the time – bottom of the chart)

As of Friday, October 3, US stocks had returned 15% year-to-date.

Applying her research to today’s market environment, Rabe at DataTrek concludes: “based on historical seasonal returns over the last 45 years, the S&P has significantly higher odds of peaking in the final quarter of this year rather than in September.”

It’s important to recognize that past performance doesn’t guarantee future results. But we can use history as a guide and as a way of informing our thinking about how things may unfold in the future.

While we avoid using terms such as “with certainty” and “without doubt”, the current environment of economic expansion, strong company earnings, and a Federal Reserve predisposed to bring down short-term interest rates seems conducive to a continuation of positive financial market trends, both for stocks and bonds.

That said, one area of emerging weakness which we’re watching closely is the US labor market.

The chart below from JP Morgan Asset Management presents monthly jobs gains using data from the Bureau of Labor Statistics. It shows that job growth slowed meaningfully over the summer of 2025.

Source: JP Morgan Asset Management.

Monthly jobs gains had been inflated because of “pandemic catch up” in 2021 and 2022 but still averaged over 200,000 jobs per month in the last couple of years through spring 2025.

This trend moved down to an average of 29,000 new jobs per month this summer.

If the employment situation downshifts further into persistent net job losses (yet to be determined) this could put downward pressure on US economic growth and put the stock market “good times” at risk.

And a new source of uncertainly stems from the shutdown of the US federal government. More information on that situation in next week’s upcoming blog “Government Shutdown Briefing”.

-RK

Government Shutdown Briefing

At a time when financial markets are experiencing good cheer, many government employees are not.

At 12:01 AM on October 1st, the US government shut down. Many people on Main Street are unsure of what this means. In the following article, we try to bring some clarity to the situation.

Politics Behind the Shutdown

The current dispute revolves around a Republican bill to continue funding the federal government for the next seven weeks while a full-year spending bill is worked out.

Senate Democrats have refused to advance the so-called “continuing resolution” (short-term funding bill) unless Republicans agree to extend certain health care subsidies under the Affordable Care Act that are due to expire soon, and to reverse Medicaid cuts made earlier this year.

Republicans have proposed a clean extension of government spending authority with no strings attached, which runs through the middle of November. Democrats have pushed back on this proposal due to the expiration of healthcare subsidies at year-end.

At least eight Democrats would need to join Senate Republicans to pass a spending bill. So far, three have.

Employment Impact

The shutdown could suspend the work of at least 600,000 government workers out of a total 2.1 million government employees, according to the New York Times. The majority of affected workers come from the Department of Defense.

Federal government employees who are furloughed during a shutdown are guaranteed to receive back pay once the government reopens.

Statements from Trump Administration officials indicate that some non-essential workers could be permanently let go. This would be different from previous shutdowns, and if followed, could have more lasting effects on the US labor market.

Economic Impact

Economists at Goldman Sachs calculate that each week of a government shutdown will shave 0.15 percentage points off quarterly annualized Gross Domestic Product (GDP).

Based on this analysis, it would take about one and a half months of shutdown to shave a full percentage point off quarterly output.

Currently, the quarterly annualized GDP growth rate is about 3%.

Goldman economists are quick to point out that a similar boost to growth in the following quarter (after the government re-opens) is likely, ultimately reversing the negative economic impact.

One concern for retirees likely is: what happens to Social Security payments?

Despite the budget impasse, Social Security recipients will continue getting their monthly payments.

Social Security benefits fall under the category of “mandatory spending.” They have a dedicated, permanent funding source (primarily payroll taxes) and are unaffected by the federal appropriations process.

The staff of the Social Security Administration, however, will be affected.

According to AARP, 88% of the SSA’s 45,600 workforce will remain on the job without pay to maintain essential functions and services. About 6,200 staff are being furloughed.

What the Opinion Polls Say

Recent polling on the topic has consistently shown (according to Goldman Sachs) that more voters are blaming Republicans over Democrats for the shutdown, which thus far has emboldened Democrats to hold their ground and not compromise on their healthcare demands.

Inflection Point

October 15th is a military pay date; if the shutdown goes beyond this day, active-duty military personnel will miss their entire paycheck, which has not happened in past shutdowns.

There is likely little appetite from both parties for this to happen, so 10/15 may end up being a forcing event for both sides to come to an agreement which would end the shutdown.

The chart below maps out the nine government shutdowns since 1981 by date and number of days (courtesy of Capital Group).

Source: Capital Group

Shutdowns tend to be brief, but the time until reopening has gotten longer in recent years. And previous shutdowns have had little effect on financial markets and the US economy.

According to Capital Group, “historically risk assets dip slightly during a shutdown’s immediate aftermath, but these moves are often small and tend to reverse once the government resumes normal operations.”

The wildcard in the current shutdown is the degree to which the Trump Administration turns furloughs into permanent layoffs.

-RK

Understanding Sustainable Investing

The battle against climate change is becoming near omnipresent. From electric cars to solar energy to the increasing popularity of reusable water bottles, many people are now more conscious than ever of the indirect costs of their actions.

Sustainability extends beyond consumer products and clean energy.

With increasing conscientiousness, sustainable investing enables investors to align their values with their financial goals.

The attached paper, Understanding Sustainable Investing, was authored by our summer intern Greg Kania (who has since decamped to finish his final year of undergraduate work).

This paper gives background on sustainability in the investment space, and will be of interest to those who are curious about ESG and SRI, as well as to investors who are already employing sustainable investing strategies.

Here’s a summary of what the paper seeks to do:

  • define and contextualize various sustainability terms
  • provide a history of sustainable investing
  • discuss greenwashing
  • present ESG scoring methodologies
  • update readers on recent trends
  • address the question: am I likely to forgo returns if I choose a sustainable investment strategy?

Click on the link above or the image below to download.

We hope you find the paper useful, and we welcome your comments!

-RK

Education Planning and OBBBA

We have seen lots of changes to the Federal student loan system over the last five years, specifically related to COVID.

The student loan payment system was already complicated before COVID, and during COVID we saw many options for assistance to borrowers such as suspended payments, interest freezes, and some temporary forgiveness plans.

With the passage of OBBBA, we are seeing some dramatic changes to student and parent borrowing limits, as well as increasing payment obligations – especially for graduate student and parent loans.

This may have a significant impact on borrowing strategies for families planning for college. Below we highlight key changes related to college financing resulting from OBBBA.

Borrowing Limits for Graduate Students

  • The Graduate PLUS Loan is being eliminated 
  • Previously there were no caps on this loan and many graduate students relied on this for financing graduate and medical programs
  • The Direct Unsubsidized Loan program will be sole source of Federal borrowing with new lifetime limits
  • Pre-existing cap of $20,500 per year for graduate students ($50,000 for professional degrees)
  • New Aggregate Limit of $100,000 ($200,000 for professional students)
  • New lifetime borrowing limit cap of $257,600 across all Federal loan programs (excluding Parent PLUS)

Borrowing Limits for Parents (PLUS) & Undergrads

  • New $20,000 cap per year per child
  • New $65,000 lifetime cap per student
  • Federal undergraduate student loans remain unchanged at a loan cap of $27,000 for four years, or $31,000 for students who take longer to receive their degree.

New Repayment Assistance Plan (RAP) 

  • Will be the default for many borrowers
  • Calculating monthly payments based on progressive formula tied to Adjusted Gross Income
  • Subsidizes unpaid interest (eliminating negative amortization)
  • Forgiveness after 30 years of repayment
  • All Legacy IDR (Income Driven Repayment) Plans will be phased out by July 2028 

Summarizing the Changes 

There are some impactful and positive changes to the new loan system.

Having less complicated systems for repayment, limits on borrowing per year and lifetime limits will add some guardrails for those parents and students who previously were able to borrow significantly past their means.

For some, the previous situation led to unmanageable debt, and no way to keep up with payments and balances that exponentially increased due to compounding interest.

The new changes from the OBBBA may have a significant impact on both how people plan for financing college, and their overall personal financial planning goals. 

Many families who have not planned well, or who have had the unfortunate bad timing of negative financial circumstances that happen at the same time as college, were able to use easily obtainable loans such as the Parent PLUS loan.

This loan is much less strict for the approval process to the applicant, allowing many parents to borrow tens of thousands of dollars each year for four years for their student, even when it was a bad financial decision for their circumstances.

While these loan changes may create more difficulties for some parents when making a financing plan for their children for college, the overall effect may help them incur less financial burden, and possibly less negative affect on their retirement savings, which some parents sacrifice for their child’s education.

These changes may start to reshape how much students and parents are willing to borrow beyond what is financially sensible for their situation and being driven by the goal of a “Dream School”.

Placing limits on borrowing will hopefully help some families make better college decisions that are based on cost and college funding that makes sense for them.

Potentially we could see a significant reduction in the overall educational loan debt for families in America over time.

-DC

Tax Planning and OBBBA

Every client’s situation is unique, but it’s helpful to consider a few categories that many folks fall into, to illustrate potential effects and possible tax planning moves you might consider following the passage of OBBBA.

In the article that follows, we cover those demographics likely to benefit most from the tax changes and then divide each category into Singles and Married Couples, so that you can reference a profile consistent with your stage of life and tax filing status.

Clients in Mid-Career

Situation: You’re in your prime working years, possibly with kids at home or in college. You might have a mortgage, you’re saving for retirement, and you could be in a high tax bracket due to dual income or career success.

Mid-Career Singles

If you’re single (or a single head of household) in this stage, your tax rates will remain at the current lower levels going forward, giving you stability. You won’t see your 24% bracket jump to 28% in 2026, for instance – it stays 24%.

The higher standard deduction is now permanent, meaning if you aren’t a homeowner or otherwise don’t itemize, you’ll continue to get a larger deduction each year.

However, with the new SALT (State and Local Tax) cap increase, you might actually benefit from itemizing if you own a home or live in a high-tax area.

For example, if you pay $8k in state taxes and $7k in property tax, previously you could only deduct $10k of that; now you could deduct the full $15k.

Combined with other itemizables (charity, mortgage interest), you may exceed the standard deduction and lower your taxable income further.

We recommend calculating this each year to determine if you could benefit from itemizing.

Also be mindful of the SALT cap phase-out: if your income is approaching ~$500k, there could be a marginal “tax bump” where deductions phase down.

It’s a consideration if, say, you’re negotiating a bonus or liquidating stock options – it might be worth spreading income over two years to keep AGI (Adjusted Gross Income) under that threshold and maximize deductions.

One more note: if you have any side business or 1099 income, remember that the 20% QBI deduction (Qualified Business Income) is permanent, so continue to keep good records of business expenses and income to fully utilize that break each year.

Mid-Career Married Couples

Dual-income couples will likewise benefit from the permanent lower brackets and the standard deduction. You’ll also get the slightly higher child tax credit if you have kids under 17 – an extra $200 per child annually.

Many taxpayers could benefit from the new $40k SALT deduction cap. In states like Massachusetts, a married couple with two decent incomes can easily pay over $20k in state income tax plus property taxes.

Now you’ll be able to deduct up to $40k of those taxes, which could make a significant difference in your itemized deductions.

Suppose you pay $15k state + $12k property = $27k, and you also have $5k of mortgage interest and donate $5k to charity – that total $37k would all be deductible (well above the ~$31k standard amount).

If your situation mirrors the example above, then for 2025–2029, you’d itemize and cut more off your taxable income. Look for tax-planning help in identifying if you cross that threshold.

As a strategy, consider “bunching” charitable donations (if you’re inclined toward charitable giving) into certain years to maximize your deductions. Because of the new 0.5% AGI floor on charity from 2026, you get more bang for your donated buck by concentrating gifts.

For example, instead of $5k each year, doing $10k every other year might yield a better tax result. You can facilitate this via donor-advised funds if desired.

Also, if you’re paying a mortgage, note that mortgage insurance (PMI) will be deductible again starting in 2026 – not a huge factor unless you bought recently with a small down payment, but worth knowing.

Overall, mid-career couples should find that they have a few more deductions to work with and no looming tax rate hikes, which may then allow you to invest more, set aside additional saving for college, and possibly accelerate income (like Roth conversions or stock option exercises) during these relatively low-tax years.

Clients Approaching Retirement

Situation: You’re within shouting distance of retirement, maybe planning to retire in the next 5-10 years. You’re thinking about Social Security, transition of income sources, and positioning your portfolio for withdrawals.

Approaching Retirement – Singles

If you’re single and nearing retirement, one key takeaway from OBBBA is tax predictability as you transition away from full-time work. The marginal rates you pay now on your salary will likely be the same or even lower when you switch over to retirement income streams.

This makes planning things like Roth IRA conversions or when to claim Social Security a bit easier, since we don’t have to worry about a major across-the-board tax increase in 2026.

Another benefit: if you’ll be 65 or older during 2025–2028, you’ll get that additional $6k deduction each year. Suppose you plan to retire at 66 in 2026 – your first few years in retirement (2026–2028) will have this built-in tax break.

You could use that to, for example, convert an extra $6k from your traditional IRA to a Roth IRA each year tax-free, or take slightly larger distributions in those years without tax.

You will need to watch the phase-out: if you have significant income from a pension or a high Required Minimum Distribution (RMD), and your AGI creeps above ~$75k, that $6k deduction starts shrinking.

It might influence things like whether to do partial Roth conversions (to keep AGI in a range that preserves the senior deduction).

Also, note that Social Security taxation hasn’t changed – up to 85% of benefits can still be taxable depending on your other income.

The new deductions can help reduce the taxable portion indirectly (since they lower overall AGI), but the formula is the same.

One strategy could be to take more income in 2025–2028 while you have extra deductions and maybe delay some income in 2029 when the senior deduction ends (if that makes sense with RMDs, etc.).

Approaching Retirement – Married Couples

For couples nearing retirement, the alignment of retiring and these tax changes is quite favorable.

If you both retire by, say, 2026, you’ll slide into retirement with permanently lower tax rates locked in and a four-year window of extra deductions (if at least one of you is 65+, and certainly if both are).

Let’s say one spouse is 65 and the other 63 in 2025: you’d get $6k extra in 2025 (for the older spouse), and by 2027 when both are 65, you’d get the full $12k extra for 2027–2028. This effectively gives you more tax-free income capacity.

A 65+ couple can have about $46k of income with no tax in 2025; by 2028 that will be a bit higher with inflation adjustments. This means many couples with moderate levels of income will pay very little tax in the first years of retirement on distributions, pensions, etc.

You’ll want to maximize the use of the 0% tax bracket – perhaps by doing Roth conversions or harvesting gains from investments while they’re free of tax.

Also, if you own a business and are selling it as you retire, or you plan to sell real estate, try (if possible) to schedule that sale’s income into these lower-tax years of 2025–2028.

Capturing a large capital gain in a year when you have a sizable standard deduction plus senior deduction could significantly reduce how much tax you pay on the sale.

One caution: if you have a high salary or large capital gain in 2025 and retire in 2026, be mindful that in 2025 your income might be high enough to phase out the senior deduction if one of you is 65 that year.

Lastly, regarding Social Security and Medicare – remember Medicare premiums (IRMAA surcharges) are tied to AGI from two years prior.

If you do take advantage of these low-tax years to convert a lot of IRA money to Roth, you’ll have to watch not to inadvertently spike your AGI too high and trigger high Medicare premiums down the road. It’s a balancing act: taxes vs. IRMAA.

Retired Clients

Situation: You are fully or mostly retired, living off Social Security, pensions, and/or portfolio withdrawals. You’re concerned with maintaining your lifestyle, managing RMDs, and preserving wealth for later in life or heirs.

Retired Clients – Singles

As a retired individual, you may not have thought a big new tax law would do much for you. After all, you’re not earning wages or running a business. But OBBBA actually gives retirees some tangible benefits.

First, the $6k senior deduction means you can have more income without paying tax (if you’re 65+ with income of less than $75k). If your income needs are modest (for example, mostly Social Security plus a bit of IRA withdrawal), you might find you owe zero federal income tax now.

For instance, Social Security gets special tax treatment (a minimum of 15% of Social Security income is untaxed for all recipients).

Combining that with a ~$23k total deduction (standard + new senior deduction) means many single retirees can have, say, $30-40k gross income and still pay virtually nothing in federal tax.

Additionally, the SALT cap increase could benefit you if you still own a home and pay significant property taxes. Perhaps you weren’t itemizing the last few years because the $10k SALT limit plus your other write-offs didn’t exceed the standard deduction.

But now, if you pay $12k in property tax and $5k in state tax (maybe on your IRA distributions being taxed by Massachusetts), that $17k would be fully deductible (under the $40k cap).

Add charitable contributions and maybe some mortgage interest if you still have one, and you might well exceed the ~$18k standard deduction.

Many retirees also give to charity— if you itemize, remember the new 0.5% rule: it’s minor, but you might consider consolidating gifts or using Qualified Charitable Distributions from your IRA if you’re over 70½, which let you satisfy your RMD by giving to charity tax-free, a strategy that bypasses the deduction limits entirely.

The main idea is: more of your money might stay in your pocket due to the senior deduction and SALT relief, but you should tailor your IRA withdrawal strategy to make the best use of these tax breaks now.

This might mean doing slightly higher withdrawals in 2025–2028 and a bit less later, effectively smoothing out taxes over time.

Retired Clients – Married Couples

Retired couples possibly may receive the biggest windfall from the OBBBA changes.

As noted, a married 65+ couple can have around $46k of income in 2025 and fall in the 0% tax bracket. That threshold will likely be around $50k by 2028 due to inflation adjustments on the standard deduction.

And even beyond that level, your next dollars are taxed at only 10%, then 12%, etc., with those rates staying lower permanently. This essentially means your retirement withdrawals and income can go further because less is paid in taxes.

One strategy we highly recommend that you consider is Roth conversions during 2025–2028 up to the amount that fills your 0% and maybe 10% bracket (or perhaps even higher tax brackets, depending on your personal situation).

For example, if you typically have $30k of taxable income (after deductions) in retirement, you might convert an extra ~$15k of IRA money to Roth each of those years and still be at a 0% tax rate on that conversion because of the deductions.

Even beyond the zero bracket, converting at 10% or 12% to fill your tax bracket is quite attractive (since down the road, RMDs could force that money out at higher rates if tax laws ever change or if you’re in a higher bracket then).

Additionally, if you have a large taxable brokerage account, you can realize capital gains up to the point that keeps you in the 0% capital gains bracket (which in 2025 for a married couple is roughly up to $96k of total income).

The stable tax environment with bigger deductions allows some creative balancing of where you draw funds – from IRAs, Roths, or taxable accounts – to manage not just taxes now but in the future.

And if you intend to help family (children, grandchildren), the Trump Accounts or gifting strategies can be employed without worrying about losing your own tax benefits (since the estate tax issue is largely moot federally for most taxpayers).

One caution for high-income retirees: if, for example, you have a large pension and significant investment income putting you in the top bracket (37%), note that your itemized deductions might be trimmed by the new 35% limitation rule, and your SALT cap might effectively still be $10k due to the phase-out.

In other words, very high-income retirees don’t benefit from some of these changes. But that is not the typical scenario, as most retirees have less income than when they were working.

For the majority of retired couples, however, this law provides more breathing room and more planning opportunities to ensure your money is as tax-efficient as possible.

-RK

August 2025 Market Update: Good Times for Investors

One way to characterize “good times” in the financial markets is when prices go up and returns are positive. Based solely on these criteria, August was a good time: stockholders have recently enjoyed four consecutive months of good times.

Another gauge of good times is when stock market indices reach an all-time high point. This has happened twenty times so far in 2025 for the S&P 500 index of large company US stocks – and most recently on August 28.

In addition to stocks, bonds show evidence of good times, too. Credit spreads, which measure the extra yield above risk-free Treasuries that bond investors demand for holding riskier corporate bonds, are approaching all-time lows.

This means bond investors are demanding only modest compensation to hold riskier corporate obligations, when compared to safer government obligations.

For many investors, though, today’s good times are paired with worry.

Two articles published recently encapsulate this concern:

  • US Stocks Are Now Pricier Than They Were in the Dot-Com Era subtitle: The S&P 500 has never been this expensive, or more concentrated in fewer companies – Wall Street Journal
  • Credit Fuels the AI Boom, And Fears of a Bubble subtitle: Plenty more deals are coming – Bloomberg

Both articles question the ability of the stock and bond markets to continue to deliver exceptional returns – but interestingly, neither predict “the end is nigh” for the financial markets.

Many investors seem to be left with an unpalatable choice: either climb the wall of worry or stop climbing and get off the wall.

With this sentiment in mind, I started thinking more deeply about the idea of climbing the wall of worry, and if it was particular to periods where markets had strong momentum and stock indices were reaching ever-higher high points.

It turns out this does not seem to be the case. Rather, it seems that many investors tend to worry all the time.

A quick web search produced at least one article by a financial institution with the phrase “climb the wall of worry” written in each year of the past decade.

The most recent “wall of worry” article that I found, produced in July by JP Morgan, references an extensive study by their well-regarded investment strategist Michael Cembalest, who contends that markets rarely reward fear-based decision-making.

Cembalest catalogued the dates when well-known forecasters and fund managers issued apocalyptic warnings, and he charted what would have happened over time if an investor had acted on those warnings by selling stocks and buying bonds.

The long-term results of “listening to the Armageddonists” have been unfavorable, as shown below.

Source: JP Morgan Asset Management

The takeaway is not to never sell stocks, nor is it a case against owning bonds. Rather, the message is to refrain from letting one’s worries progress to actions that result in unbalanced or inappropriate portfolio allocations.

Volatility, and a measure of worry, is the price investors often must pay for satisfactory long-term returns.

In August, returns were good across the board. Large company US technology stocks delivered positive returns but surrendered their leadership status.

US small company stocks, slower-growing companies that prioritize paying dividends to shareholders, and foreign company stocks all generally outperformed US technology stocks last month.

Also, foreign currencies generally strengthened when compared to the US dollar, which gave an additional boost to foreign stock funds, when performance was measured in dollar terms.

US Treasury bond yields generally declined in August, which translated to positive performance for most bond funds, too.

One exception was longer-term bonds.

The yield of the 30-year Treasury bond, for example, climbed by 0.03 percentage points in August and settled at 4.92% at month end. This resulted in negative returns for some bond funds with holdings concentrated in long-maturity debt.

The chart below shows financial market performance for the month of August and Year-to-Date (YTD):

Source: Moore Financial Advisors & Morningstar

-RK

It Is Always a Good Time to Start College Planning

Beginning college planning can be an overwhelming thought for anyone. The thing about college planning is – the sooner you start, the better and calmer you will feel about the whole process.

So, I will say it again… it is ALWAYS a good time to start.

I have met with and counseled many families for their college planning needs, as a financial advisor, and while working at universities.

One common theme I have found in speaking with parents is that many are really overwhelmed and do not know where to start.

Also, many families delay taking the initial steps due to the paralyzing fear of paying the high price of a college education and finding the perfect school for their student.

Some basic strategies listed below are designed to help parents with students of any age as they begin (or continue) to plan and prepare for the college process.

Early Planning and Saving

  • Open a 529 College Savings Plan account: This will give you tax advantages, as well as compounding growth over time- even with small contributions. And especially if you can start early.

Start Talking About College – Frame It as a Goal

  • Begin conversations about education after high school and explore all options.
  • Keep it positive, age-appropriate, and flexible. This approach will help keep you all informed on perspectives as time goes on.

Focus on Academics and Study Habits

  • A strong academic foundation is important; it will support the student and allow for further growth during their college career.
  • Encourage strong study skills, reading habits and time management early on.
  • Good grades and test scores help improve chances of admission.

Get the Student Involved

  • Teach the basics of a budget, and the value of saving.
  • Encourage part-time work or a summer job to contribute to expenses or savings.

Have Students Get Involved in Interests

  • Hobbies, extracurricular activities, volunteering and sometimes sports will help a student develop and find areas of interest.
  • This will help build character and leadership skills and prepare for future college applications.
  • This also helps a student’s potential for acceptance and merit scholarships. Many schools take a holistic approach to reviewing applications, and involvement and leadership roles are highly valued.

Understand Total College Costs

  • Begin looking at a variety of public and private schools online and review total Cost of Attendance. It may be shocking when you start out, but it is necessary to be informed before you begin.
  • As your student gets older, start to use Net Price Calculators on school websites for estimates of financial aid and possibly merit scholarships.
  • Also, when you approach the planning stages in high school, learn how the FAFSA and CSS Profile work.
  • FAFSA
  • CSS Profile
  • Understand the different types of aid, grants, scholarships, loans, work study, etc.

Understand your financial situation and what you can afford

  • Be realistic about your budget, what you can contribute and avoid unnecessary debt.
  • Start family discussions on expectations early. Be clear on what you are willing and able to contribute to college for your student. This avoids big disappointments late in the decision-making process.
  • Apply for private scholarships early and often.
  • Here are a few:
  • Fastweb
  • RISLA
  • Scholarship America

College Selection and Prep

  • Focus on fit, not prestige.
  • Consider multiple types of schools, including in-state schools which offer lower tuition.
  • As you get further into the process and start your list, be sure to focus on academic programs, size, campus location and culture, and student activities and support resources.

Prepare Your Student with Good Life Skills

  • Help your student with organization for college application season but let them own the process.
  • Help by being supportive and help them explore options rather than choosing for them.
  • Foster independence by teaching life skills- the basics include laundry, budgeting, and problem-solving.
  • Discuss self-care and mental health and how to stay healthy while at college.

While there is much more detail to the college process, if you are beginning to think about college for your student, or you are just starting to get into the steps in the process, hopefully you find some good takeaways here.

Remember this really is a marathon, not a sprint, so try to stay calm and focused but remember to enjoy this time and have some fun as well. It will all go by so much faster than you imagined!

The Outlook for Social Security

In this article, MFA founder Susan Moore demystifies the headlines and hype around Social Security, and answers questions that are on the minds of many people who are approaching, or already in, retirement.

With Social Security often in the headlines, many of you have asked: Will it still be there when I retire? Will my benefits be cut?

These are valid concerns—and we’d like to share where things currently stand, what’s being discussed in Washington, and how it could impact your planning.

When Will the Social Security Trust Fund Run Out?

According to the 2025 Trustees Report, the Social Security Trust Fund is projected to be depleted by 2033. At that point, the program would rely solely on ongoing payroll taxes to pay benefits, which are expected to cover about 77% of scheduled payments.

If no changes are made, benefits would be automatically reduced by roughly 23% starting in 2033.

What Would Benefit Reduction Mean?

If reductions occur across the board, here’s what the estimated impact could look like by income tier:

Source: Moore Financial Advisors

Will Cuts Affect Current Retirees?

This is one of the most frequent questions we’re asked. So far, Congress has never reduced benefits for current retirees

Most proposals focus on future beneficiaries or apply gradual changes, such as adjusting the retirement age or benefit formulas for younger workers.

However, if lawmakers do nothing, all beneficiaries—current and future—would face automatic cuts in 2033 due to the trust fund running dry.

What Is Being Proposed to Fix This?

There are several ideas on the table, but no consensus yet. Here are a few commonly discussed options:

  1. Raising the Full Retirement Age (FRA) Budget proposals supported by the Republican Study Committee and Project 2025 have called for increasing FRA from 67 to 69; some versions of these proposals would roll out before 2033. This effectively cuts benefits for many, especially low- and middle-income workers, even if reductions aren’t framed as “cuts.”
  2. Lifting the Payroll Tax Cap Currently, wages above $176,100 (2025) are not taxed for Social Security. One proposal would apply payroll taxes on income up to $250,000.
  3. Targeted Cuts for Higher Earners Some reform plans propose benefit reductions for higher earners while preserving or increasing them for lower earners. These reductions would go into effect around 2029 for new beneficiaries with higher incomes, phasing reductions up to 50% for individuals earning over $180,000 in modified adjusted gross income (MAGI) or joint earners over $360,000.
  4. Increasing Payroll Taxes Slightly Raising the 6.2% payroll tax to 6.4% or higher to bring in more revenue.
  5. Means Testing Some proposals suggest reducing benefits or slowing the cost of living adjustment (COLA) for retirees with high net worth or income from other sources.
  6. Backdoor Privatization Plans Recently Treasury Secretary Scott Bessent said that “Trump baby accounts” or child savings accounts are a back door for privatizing Social Security, although he later back-peddled on that statement. This raised concerns about eventually shifting FICA payroll tax funding into private investment vehicles—undermining Social Security’s defined-benefit structure and reducing program coverage over time—even if not explicitly cutting current benefits.
  7. Alternative Funding Models Republican Senator Bill Cassidy and Democratic Senator Tim Kaine have proposed an alternative funding model for the safety net program, which would supplement the program’s Trust Fund with a new diversified pool of investments. Their proposal would create a new, parallel investment fund for Social Security. They estimate that the fund would require an up-front federal investment of $1.5 trillion, and propose that it be given 75 years to grow. The Treasury would shoulder the burden of supporting current benefit levels through borrowing during those 75 years. At the end of 75 years, the fund would pay the Treasury back and supplement payroll taxes to help fill the future gap.

Important: No plan has been signed into law yet—but there is broad bipartisan agreement that something must be done before 2033.

If I’m Eligible, Should I Start Benefits Now?

If you’ve reached Full Retirement Age (FRA, currently 67) and are waiting until age 70 to claim your maximum benefit, you may be wondering if you should claim now to avoid possible benefit reductions in the future.

Here’s our advice:

  • There’s no clear reason to change course—yet.
  • For now, the rules remain unchanged. By waiting until age 70, you still earn delayed retirement credits, increasing your benefit by up to 8% per year between FRA and 70.
  • Current beneficiaries are the least likely to face reductions.
  • Starting benefits now doesn’t necessarily “lock in” protection against cuts—but neither does waiting expose you to significantly more risk. Historically, any benefit reductions or reforms have applied to future retirees, not those already collecting. Some proposals (see below) include making changes before 2033, but none to date include cuts for current beneficiaries before 2029.
  • Cuts (if they happen) would likely be phased in or income-based.
  • Congress has options. For example, they could preserve full benefits for those already collecting, or protect lower earners while modifying formulas for higher-income individuals.
  • We recommend continuing to base your claiming decision on longevity, tax, and income needs, not on speculation. If your plan supports delaying until 70, it likely still makes sense to do so—unless there’s a sudden policy change (which we will monitor closely).

What Does This Mean for Your Financial Plan?

While the uncertainty surrounding Social Security is real, it’s important to remember:

  • Cuts are not guaranteed, and changes are likely to be phased in
  • If you’re already collecting—or soon will be—you are less likely to see reductions
  • For younger clients, we plan with a margin of safety—factoring in modest benefit reductions as part of our retirement projections

As always, we are monitoring developments and will adjust your plan if needed.

If you have questions about how Social Security fits into your personal plan—or if you’re nearing retirement and want to discuss timing your benefits—please reach out.

-SM