All Posts By

Donna Cournoyer

How Much Can You Spend in Retirement?

Two of the more common questions Susan, Donna, and I hear as planners are of vital importance for those thinking about their financial future are:

  • “How do I know if I have enough saved for retirement?”
  • “How much can I safely spend each year without running out of money?”

These are questions without a simple universal answers. But there are two powerful tools that can help: the 4% rule, a well-known rule of thumb rooted in decades of research, and a personalized probability of success analysis, which we build for our clients using financial planning software.

In this article, we want to explain both measures — where each comes from, what it can tell you, and how they can work together to give you a more complete picture of your retirement readiness.

The 4% Rule: A Historically-Grounded Starting Point

The 4% rule was developed in 1994 by financial planner and researcher William Bengen, who set out to answer a question that no one had systematically studied before: what is the maximum amount a retiree can withdraw each year without running out of money?

Rather than guessing about future market returns, Bengen turned to history.

He studied the actual investment returns and inflation data for every quarter going back to January 1926, and reconstructed what would have happened to someone who retired on a specific date, withdrew a set percentage of their savings in their first year, then adjusted that dollar amount for inflation every year thereafter — similar to how Social Security’s cost-of-living adjustment works.

Bengen studied hundreds of historical retirees, asking: what is the highest withdrawal rate that would have worked for all of them, including those who retired at the worst possible moments in market history?

Results of Bengen’s Study

The answer: 4% (and with a more diversified portfolio, up to 4.7%). A retiree who withdrew 4% of their starting portfolio value in year one, then adjusted that dollar amount for inflation each subsequent year, would have maintained their portfolio for at least 30 years regardless of when in history they retired — through the Great Depression, the stagflation of the 1970s, the dot-com crash, and the 2008 financial crisis.

In plain terms, a retiree with $1,000,000 in savings could withdraw $40,000 in their first year. If inflation ran at 3% that year, they would take $41,200 in year two, and so on. According to this framework, they would not have run out of money over a 30-year retirement, even in the worst historical environments.

Here’s something important that often surprises people: the 4% rule was calibrated to the single most difficult retirement outcome in nearly a century of data — a retiree who started in October 1968 and faced both a severe bear market and a prolonged period of high inflation. That one cohort ended their 30-year retirement with essentially nothing left.

For virtually every other retiree in history following the same 4% rule, portfolios not only survived — they grew.

Many retirees ended their 30 years with substantially more wealth, in real terms, than they started with. The long-run average across all historical retirees was closer to 7%, meaning most people could have withdrawn nearly double the 4% rate without running out of money.

What the 4% Rule Does Well

  • Grounded in real history, not assumptions about the future
  • Provides a quick, memorable benchmark: ff you’re withdrawing less than 4% of your savings each year, you’re in a strong position historically speaking
  • Reflects actual worst-case scenarios — the kinds of markets and inflation environments that genuinely tested retirees

What It Doesn’t Capture

Bengen himself is clear that the rule was never meant to be a universal prescription and that treating it as one is itself a problem. Because the rule is calibrated to a single worst-case cohort, applying it universally causes most retirees to spend far less than they safely could.

In a recent Morningstar interview, Bengen described the 4% rule as applying only to a very narrow set of circumstances — specifically, retirees facing both high inflation and very high stock market valuations simultaneously — and stressed that most people can do considerably better with a personalized approach.

Beyond the underspending risk, your retirement situation is unique in ways the 4% rule doesn’t account for:

  • Your tax situation. Withdrawals from taxable accounts are subject to capital gains and income taxes that can meaningfully reduce your spending power — potentially requiring a more conservative withdrawal rate.
  • Your timeline. If you retire at 60 and live to 95, you need your money to last 35 years, not 30. A longer time horizon calls for a lower initial withdrawal rate.
  • Your specific goals. Whether you intend to leave an inheritance, cover long-term care costs, or adjust your spending significantly over time all affect what’s appropriate for you.
  • Current market conditions. Bengen’s research shows that safe withdrawal rates are closely tied to stock market valuations. With today’s market valuations on the higher end of the historical range, the future may look somewhat different than the historical average.

A Note on Inflation

Bengen calls inflation “the greatest enemy of retirees”.

Unlike a market downturn, which typically recovers, sustained high inflation forces retirees to take larger and larger withdrawals over time – accelerating the depletion of their savings.

This is one reason why we pay close attention to inflation trends in general, and specifically for your financial plan. It’s also why a regular review of your plan is recommended.

Probability of Success: Your Personalized Financial Plan

While the 4% rule provides a useful starting point, your financial plan is designed to go much further — and its central metric (in the RightCapital financial planning software that we use with our clients) is called the Probability of Success.

How It Works

The Probability of Success represents the percentage of simulated futures in which your plan does not run out of money during your lifetime.

Here’s how it’s calculated: The software runs 1,000 separate simulations of your financial future. Each simulation uses a different random sequence of investment returns and inflation rates, all drawn from historical market behavior.

One simulation might reflect a scenario similar to the 1970s stagflation; another might mirror the strong markets of the 1990s; another might look like a prolonged downturn shortly after you retire.

After all 1,000 simulations are complete, the software counts how many ended with money still in your plan. If 870 out of 1,000 simulations ended with a positive balance, your Probability of Success is 87%.

What Score Should You Be Aiming For?

We typically target a Probability of Success in the range of 80% to 90% for our clients. Here’s why we find that range to be an appropriate outcome:

  • A score above 90% is a sign of strength, but it can also indicate that you’re spending less than you could comfortably afford. If your score is very high, it may be worth discussing whether you could increase your spending, give more to family or charity, or retire earlier.
  • A score between 80% and 90% means your plan is well-positioned. It has weathered the most stressful simulated environments with a strong success rate.
  • A score between 70% and 80% suggests the plan could benefit from some adjustments — whether to spending levels, savings, retirement timing, or portfolio allocation.
  • A score below 70% is a signal that more significant changes may be needed.

A plan that succeeds in 100% of simulations is typical one that is very conservative, often meaning you’re spending significantly less than history suggests you could.

We recognize that for some clients, this level of conservatism is preferable. For those clients who have plans with the strongest outcome, though, thinking more expansively about approaches to spending may also merit consideration.

What Makes Your Score Go Up or Down?

Your Probability of Success is driven by the specific details of your plan, including:

  • Your annual retirement spending. This is typically the most powerful lever. Modestly reducing planned spending can meaningfully improve the score; increasing it has the opposite effect.
  • When you retire. Delaying retirement by even a year or two can improve the score significantly, both by extending the savings period and by shortening the distribution period.
  • Your portfolio allocation. The mix of stocks, bonds, and other assets affects both expected returns and the volatility of those returns across simulations.
  • Sources of guaranteed income. Social Security, pensions, and annuities all reduce the amount your portfolio needs to provide and tend to improve the score.

How These Two Tools Work Together

The 4% rule and your Probability of Success analysis are not competing measures, rather they complement each other, and each is better suited to a different stage of the planning conversation.

Think of the 4% rule as a compass. Before you’ve built your full financial plan, it can quickly orient you: is your situation in the right ballpark?

A prospective retiree withdrawing 3% of their savings annually has significant flexibility; one withdrawing 7% faces real constraints under almost any methodology. That early directional read is genuinely useful.

Your financial plan — and its Probability of Success — is the detailed map.

Once we know your full picture, including your income sources, taxes, goals, timeline, and spending patterns, we can build a plan that reflects your life, not a historical generalization. The probability score becomes the primary measure we track and revisit together over time.

What Both Measures Agree On

Despite using different methodologies, these two approaches are grounded in the same body of evidence about financial markets and inflation.

Bengen himself notes that his historical approach and Monte Carlo simulation generally produce similar conclusions — which is reassuring, since they’re studying the same underlying dynamics.

Both measures also point to the same warning signals:

  • A sustained rise in inflation is the condition most likely to require a meaningful reduction in withdrawals. Unlike a temporary bear market, persistent inflation continuously forces higher withdrawals, accelerating portfolio depletion.
  • A significant market decline early in retirement can have an outsized impact on the long-term health of a plan — which is why we pay special attention to portfolio construction and risk management in the years just before and after retirement.

What This Means for You

Our goal in building and maintaining your financial plan is to give you clarity and confidence — the freedom to spend, give, and live in retirement without unnecessary anxiety about money.

One of the most important things that a personalized plan can reveal is that you might have more flexibility than a simple rule of thumb suggests. Both the 4% rule and your Probability of Success are tools in service of that goal.

Here’s what we recommend for our clients:

  • Review your plan at least annually. Markets change, your spending changes, and your goals evolve. Your Probability of Success should be re-evaluated regularly in light of these changes.
  • Don’t panic at temporary market declines. History shows that most bear markets recover, and plan adjustments made in the heat of a market downturn often do more harm than good. We’ll help you assess whether any action is truly needed.
  • Take inflation seriously. If the inflation environment changes meaningfully, it’s worth a conversation about your withdrawal plan.
  • Think about your full-time horizon. Many people underestimate how long their portfolio may need to last. We encourage our clients to build in a margin of safety by planning for a longer retirement than average life expectancy.

If you’d like to review your current Probability of Success, discuss your withdrawal strategy, or simply talk through how your plan is positioned for the environment ahead, we’d love to hear from you. That’s exactly what we’re here for.

-RK

May 2026 Market Recap: The Everything Rally

ASteve Sosnick, the chief market strategist at Interactive Brokers, referred to financial market activity in May as “the Everything Rally.” That’s not a bad way to frame what happened last month.

At the start of the month, investors were confronted with an unsigned Iran peace deal, oil above $100, inflation at a three-year high, a brand-new Federal Reserve chair, and a 30-year Treasury yield touching its highest level since 2007.

May closed with Technology sector posting another double-digit monthly gain. The S&P 500 index of large company US stocks rose 5.3% and closed at record highs on 11 days during the month. Foreign stocks gained more than 2.4%, and bond indices (despite large intra-month swings in yields) registered modest positive returns.

May was defined by three themes: the Iran war and its economic consequences; AI delivering broad-based, positive revenue trends in the technology sector; and a bond market that tested investor nerves.

The Iran War — Deal Always “Just Around the Corner”

The U.S.-Iran conflict is now in its fourth month. The Strait of Hormuz remained largely closed to commercial traffic, with only a handful of ships transiting daily versus 120 before the war.

Oil prices swung dramatically on diplomatic signals: Brent crude peaked near $126 in late April, fell toward $87 by month-end, then traded at various points in between as headlines shifted from hope to frustration and back again.

The month’s diplomatic arc was a recurring pattern: a constructive signal would arrive, sending oil sharply lower and stocks higher — only to be followed by a complication. By month-end, the memorandum of understanding between the US and Iran remained unsigned, and June opened with the same central question May had posed: when will a deal be signed?

The economic consequences of the conflict were visible throughout the month. Inflation hit 3.8% year-over-year — its highest since 2023 — driven heavily by energy. National average gas prices remained above $4.50 per gallon for most of the month.

And Goldman Sachs and Barclays both cautioned that even if the Strait fully reopened tomorrow, global oil inventories are so depleted that prices likely would normalize only gradually, not immediately.

Artificial Intelligence Delivers Positive Revenue Trends

April validated that AI is driving positive financial results for chip makers. May confirmed that AI demand is broadening into other areas of the technology ecosystem.

Some examples of how AI-driven demand is benefiting tech companies:

  • Dell Technologies, which many folks associate with personal computers, reported AI server revenue up 757% year-over-year, a record $51.3 billion AI order backlog, and raised its full-year revenue forecast by roughly $27 billion.
  • Cisco, another “old-line” technology-focused company, known for its networking gear that supports internet activity, raised its full-year AI order guidance to $9 billion — nearly double what it had guided just one quarter earlier.
  • Nvidia, the new tech standard bearer that designs chips, and also hardware networks to power data centers as well as specialized software, reported $81.6 billion in quarterly revenue — up 85% year-over-year — and guided its next quarter to $91 billion.
  • Cerebras Systems, which delivers supercomputer systems and cloud-based services, listed its shares through the largest tech initial public offering (IPO) since Uber went public in 2019, saw its shares surge 68% on the first day of trading.

The broader AI narrative for the month was captured well by one market analyst: “We started with chips and memory, but it’s really now about the broad AI infrastructure stack.”

And more AI-related activity is in store for investors in the months ahead, with SpaceX, Anthropic (maker of Claude) and OpenAI (maker of ChatGPT) all expecting to list their shares through IPOs and being trading on stock market exchanges later this year.

The Bond Market’s Warning

Not everything pointed straight up in May.

The bond market delivered a warning mid-month that temporarily interrupted the equity rally. The 30-year Treasury yield approached 5.2% in mid-May – its highest level since 2007, before the financial crisis – and the 10-year Treasury yield approached 4.7% (though bond yields did decline in the back half of May).

The main driver of higher yields was the Iran war’s inflationary impact on energy prices globally. The practical consequence for US households: 30-year fixed mortgage rates climbed back to 6.68%, putting further pressure on an already-stalled housing market.

Adding to the complexity, Kevin Warsh took over as Federal Reserve Chair on May 15, inheriting a divided institution with inflation running well above its 2% target.

The probability of a Fed rate hike in 2026, which was essentially zero a month ago, climbed as high as 45% during the month. Warsh’s first formal interest rate policy decision comes June 16.

Despite the swings in yields, benchmark US bond indices delivered positive returns in May. High quality bonds returned 0.3% for the month, and low quality bonds rose 0.5%.

As June begins, the questions that defined May remain open. The Iran deal is unsigned. Inflation remains elevated. The new Fed chair faces his first policy decision with rate-hike odds that would have seemed unthinkable a few months ago.

And yet the stock market enters June at all-time highs, with US Large Company Stocks up 11.2% for the year and Foreign Stocks up 9.1%. Whether the optimism that has driven the fourth consecutive year of stock market gains (so far) proves durable is the central question for the months ahead.

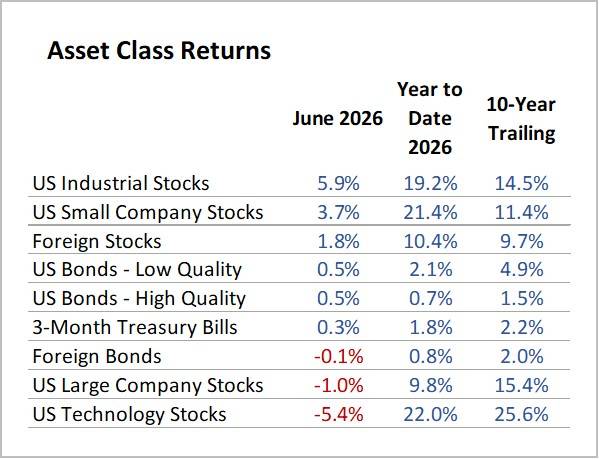
Here are results for May and 2026 Year-to-Date, compared to longer-term annualized returns (10-Year Trailing):

Note: YTD 2026 as of 5/31/2026; Source: Morningstar

-RK

More Than Enough

Even if you think of yourself as having “enough” rather than “more than enough,” if you are spending at a conservative rate from your savings, the reality is that you may well be unlikely to deplete your assets during your lifetime. Which means that, financially speaking, “enough” might turn out to be “more than enough.”

In More Than Enough: A Brief Guide to the Questions That Arise After Realizing You Have More Than You Need, author Mike Piper provides a framework for how to approach the “problem” of having more financial resources than you may need.

Topics include:

  • Do you have more than enough?
  • Who gets the money?
  • Talking with your kids and other heirs
  • Giving and spending during your lifetime
  • Learning to spend and give more

The value in Piper’s short book is not that it provides an answer key for solving the more-than-enough “problem”. Instead, for those who have saved well and lived within their means, it poses questions for self-reflection and introduces ideas that individuals may wish to consider in conjunction with their advisors, including tax professionals, estate planning attorneys, and financial planners.

Piper is a Missouri Licensed CPA, and the author of several personal finance books and the blog Oblivious Investor.

The Real Cost of Switching Majors

Choosing a major at the age of 17 or 18 is usually not easy – and switching majors in college is common. In fact, most students change their major two to three times before graduating.

While this is sometimes necessary and a healthy way to explore interests, families are often unaware that it can have a major impact on graduation date and overall cost. It is usually not a consideration in the planning process for college financing prior to choosing a college.

The potential increase in cost may not be a reason to dismiss the thought of changing majors especially if it will truly be a better path for the student. However, it is wise to anticipate the potential changes in cost and time to graduation.

Here is what to consider when talking about potential major changes.

Lost Time- Extra Semesters

This can be the biggest factor in changing majors. Adding extra semesters involves more cost.

Many majors have different core requirements and sequences of courses. Switching into a specified major such as nursing, engineering, or education for example requires foundational courses that are often different for each. Changing to a very different major can create the need for:

  • An additional semester
  • An additional full year
  • Sometimes certain courses are only offered one semester per year

We all know college costs are high, and an extra semester can cost anywhere from $12,000-$25,000 or possibly much more depending on the school.

Losing Credit for Courses Already Taken

Families often assume that if a student stays at an institution, prior coursework will apply to a change in major, but that is not always the case.

A change in major can cause:

  • Electives that no longer satisfy major requirements
  • Lost credit toward major prerequisites
  • Credits that count toward graduation, but not the new degree

Program GPA Requirements

Many competitive majors require higher GPAs for admission to the program and if admission is delayed, students may not be able to enter the program later, or may be required to retake courses or take courses that do not count toward graduation.

Effects on Scholarships and Financial Aid

Some scholarships are tied to:

  • Being in a specific major
  • Taking a minimum number of major-related credits
  • Tuition waivers- tied to majors
  • Departmental Awards- tied to majors

Emotional Impact: Pressure, Stress and Confidence

Considering the financial impact matters of course, but there are the emotional impacts on the student to consider:

  • Exploring career options in high school
  • Getting involved as a volunteer or in a program or business that you are interested in
  • Speaking to adults in your family and friend circle who work in your desired profession
  • Consider self-interests and not just popular majors
  • Your first year in college- find a great advisor and take advantage of their expertise and advice

All this information is not to say that switching majors is a sign of poor planning or failure, but rather to encourage consideration early in the process to help avoid some of the potential challenges and costs later.

The bottom line is that with the significant investment in a college education it is important for students to be in a major that will help them lead a successful and happy career after graduation.

Guide to Retirement Accounts in 2026

Every year, the IRS adjusts contribution limits for retirement savings accounts to keep pace with inflation. For 2026, those adjustments are meaningful across nearly every account type — good news for anyone working to build their financial future.

But the more important story is not the numbers themselves. It is understanding which accounts are available to you, how each one is taxed, and how to stack them intelligently based on your income, your employment situation, and how close you are to retirement.

This article is designed to serve as a practical reference. In the first section, we walk through the major tax-advantaged retirement accounts — who can use them, what the tax benefits are, and how the 2026 limits compare to 2025.

We also cover an important new rule under the SECURE 2.0 Act that took effect this year and affects catch-up contributions for higher earners in 401(k) plans.

In the second section, we bring these accounts to life through three case studies, each featuring a married couple at a different stage of life, earning a different level of income, but each with the same goal: to save ten percent of their gross household income for retirement.

As you will see, there is no single formula that works for everyone. But there is almost always a combination of accounts that can get you there in a way that is tax-efficient — and 2026 is a particularly good year to review your strategy.

Part I: The Accounts

401(k) Plans

Who is eligible. A 401(k) plan is sponsored by your employer, so eligibility depends on whether your workplace offers one. Most full-time employees at companies that sponsor a 401(k) can participate, typically after a short waiting period. Self-employed individuals can establish a Solo 401(k), which provides access to essentially the same contribution limits.

There is no income ceiling for participating in a 401(k), though highly compensated employees — generally defined as those earning more than $160,000 in 2026 — may face additional restrictions if the plan fails certain nondiscrimination tests.

Tax benefits. Traditional (pre-tax) 401(k) contributions reduce your taxable income in the year they are made. The money grows tax-deferred, and withdrawals in retirement are taxed as ordinary income. Roth 401(k) contributions are made with after-tax dollars, so there is no upfront deduction — but qualified withdrawals in retirement are completely tax-free. Employer matching contributions are always made on a pre-tax basis, regardless of whether you contribute to the traditional or Roth side.

2025 vs. 2026 contribution limits. The employee deferral limit increases from $23,500 in 2025 to $24,500 in 2026. The standard catch-up contribution for those ages 50 and older increases from $7,500 to $8,000, for a total of $32,500. For those in the 60–63 age window, SECURE 2.0 introduced a “super catch-up” that remains at $11,250 in 2026, for a total employee deferral of $35,750. The overall combined limit (employee contributions plus employer contributions) increases from $70,000 to $72,000 in 2026.

2026 Rule Change — Roth Catch-Up Requirement (SECURE 2.0). This is the most significant change affecting 401(k) plans in 2026, and it deserves careful attention.

Beginning January 1, 2026, employees who are age 50 or older and whose FICA wages with their employer exceeded $150,000 in the prior calendar year must make all catch-up contributions on a Roth (after-tax) basis. Pre-tax catch-up contributions are no longer permitted for this group. This provision had been included in the SECURE 2.0 Act but was repeatedly delayed. It is now in effect.

What does this mean practically? If you are 50 or older and earned more than $150,000 in FICA wages last year, your catch-up contributions this year will be directed into the Roth side of your 401(k) — with no upfront tax deduction, but with tax-free growth and tax-free withdrawals in retirement. The dollars still count toward your catch-up limit; only the tax treatment changes.

There is an important administrative wrinkle: if your plan does not offer a Roth option, it may not be able to accept catch-up contributions from affected employees at all. If you are in this group, we recommend verifying with your HR department or plan administrator right away.

403(b) Plans

Who is eligible. A 403(b) plan is the non-profit sector’s counterpart to the 401(k). Employees of public schools, colleges and universities, hospitals, churches, and qualifying non-profit organizations are eligible. Private-sector employees are not.

Tax benefits. The structure is identical to the 401(k): traditional (pre-tax) contributions reduce current taxable income, while Roth contributions grow and are withdrawn tax-free. The same 2026 Roth catch-up rule under SECURE 2.0 applies to 403(b) plans.

2025 vs. 2026 contribution limits. The 403(b) limits are the same as the 401(k): $24,500 employee deferral, $8,000 catch-up (age 50+), and $11,250 super catch-up (ages 60–63), up from $23,500 and $7,500 respectively in 2025.

Health Savings Accounts (HSAs)

Who is eligible. To contribute to an HSA, you must be enrolled in a qualifying High-Deductible Health Plan (HDHP), must not be enrolled in Medicare, and cannot be claimed as a dependent on someone else’s tax return. If you are covered by any other non-HDHP health plan, you are also ineligible. HSAs are not limited to employees — self-employed individuals on a qualifying HDHP can contribute as well.

Tax benefits. The HSA is unique among savings vehicles in offering what is often called the “triple tax advantage.” Contributions are made on a pre-tax basis (or are tax-deductible if made directly, outside of payroll). The funds grow completely tax-free. And withdrawals for qualified medical expenses are tax-free as well. No other account in the tax code offers all three of these benefits simultaneously.

There is a fourth benefit that is often overlooked: unlike a Flexible Spending Account (FSA), HSA funds roll over indefinitely. There is no “use it or lose it” rule. A family that contributes consistently to an HSA and pays current medical expenses out of pocket can build a substantial tax-free reservoir for future healthcare costs — which, in retirement, are typically one of the largest expenses families face.

After age 65, HSA funds can be withdrawn for any purpose and are taxed as ordinary income, much like a traditional IRA. Beyond age 65, the account can also be viewed as a second IRA with a prior history of tax-free contributions – though qualified medical withdrawals remain completely tax free at any age.

2025 vs. 2026 contribution limits. For self-only coverage, the limit increases from $4,300 to $4,400 in 2026. For family coverage, the limit increases from $8,550 to $8,750. The catch-up contribution for those age 55 and older (note: HSA catch-ups begin at 55, not 50) remains $1,000, for a total family contribution of $9,750 for eligible couples with at least one spouse aged 55 or older.

SEP IRAs (Simplified Employee Pension)

Who is eligible. A SEP IRA is a powerful savings tool available to the self-employed and to small business owners. Any sole proprietor, independent contractor, freelancer, or small business owner can establish a SEP IRA. Businesses of any size may also use a SEP for their employees, though in practice it is most commonly used by those who are self-employed or who own businesses with few or no other employees.

One important distinction: in a SEP IRA, only the employer contributes. An employee cannot make their own elective deferrals as they can in a 401(k).

If the business has employees, the employer must generally contribute the same percentage of compensation for all eligible employees as for themselves. From a business owner’s perspective, this makes SEPs potentially expensive and increasingly unattractive as a business grows.

Larger businesses generally prefer 401(k) plans, which offer more flexibility – like letting employees fund their own accounts, having vesting schedules, and allowing employer matches at lower required levels.

Tax benefits. Employer contributions to a SEP IRA are fully tax-deductible. Growth inside the account is tax-deferred, and withdrawals in retirement are taxed as ordinary income. There is no Roth option for a SEP IRA.

One particularly useful feature of the SEP IRA is its flexible timing: contributions for a given tax year can be made all the way up to the tax filing deadline, including extensions. This makes the SEP IRA an excellent planning tool — a self-employed person can wait until after year-end, see what their income was, and then decide how much to contribute before filing.

2025 vs. 2026 contribution limits. The SEP IRA limit is the lesser of $72,000 or 25% of compensation in 2026, up from $70,000 in 2025. For self-employed individuals, the calculation is slightly different: the effective contribution rate is approximately 20% of net self-employment income after the self-employment tax deduction. Catch-up contributions are not permitted in a SEP IRA.

SIMPLE IRAs

Who is eligible. SIMPLE IRAs are designed for small businesses — generally those with 100 or fewer employees who earned at least $5,000 during the prior year. Both employees and the self-employed may participate. Employers who establish a SIMPLE IRA generally cannot maintain another employer-sponsored retirement plan simultaneously.

Unlike the SEP IRA, the SIMPLE IRA allows employee contributions, making it more similar in spirit to a 401(k). Employers are required to make either a dollar-for-dollar match of up to 3% of compensation, or a flat 2% non-elective contribution for all eligible employees.

One important restriction: funds withdrawn from a SIMPLE IRA within the first two years of participation are subject to a 25% penalty (rather than the standard 10%) if taken before age 59½. Participants should be aware of this two-year rule before rolling funds out of a SIMPLE IRA.

Tax benefits. Employee contributions are pre-tax and reduce current taxable income. Growth is tax-deferred, and withdrawals in retirement are taxed as ordinary income. A Roth SIMPLE option does exist under SECURE 2.0 but has not yet been widely implemented by plan providers.

2025 vs. 2026 contribution limits. The standard employee contribution limit increases from $16,500 to $17,000 in 2026. The catch-up contribution for those age 50 and older is $4,000 (increased from $3,500 in 2025). And those ages 60 – 63 can contribute $5,250 as a “super catch up” contribution.

Employers that meet certain criteria may be eligible for the higher-limit SIMPLE IRA, which increases from $17,600 to $18,100. The catch-up contribution for those age 50 and older in the higher-limit SIMPLE plans is $3,850 (unchanged from 2025).

Traditional IRAs

Who is eligible. Anyone with earned income — or a spouse with earned income — can contribute to a traditional IRA. There is no income ceiling for contributing, but the deductibility of those contributions is phased out based on income and access to a workplace retirement plan.

For 2026, the phase-out ranges for deductibility are as follows:

  • Single filer covered by a workplace plan: phase-out from $81,000 to $91,000 (up from $79,000–$89,000 in 2025)
  • Married filing jointly, contributor covered: phase-out from $129,000 to $149,000 (up from $126,000–$146,000 in 2025)
  • Married filing jointly, spouse covered but not contributor: phase-out from $242,000 to $252,000 (up from $236,000–$246,000 in 2025)
  • No workplace plan coverage: contributions are fully deductible regardless of income

Tax benefits. If your contribution is deductible, it reduces your taxable income in the year it is made. Growth is tax-deferred, and withdrawals in retirement are taxed as ordinary income. Required Minimum Distributions (RMDs) begin at age 73 for those born prior to 1960, and at age 75 for those born in 1960 and later.

2025 vs. 2026 contribution limits. The contribution limit increases from $7,000 to $7,500 in 2026. The catch-up contribution for those age 50 and older increases from $1,000 to $1,100 — the first increase to the IRA catch-up since 2006.

SECURE 2.0 indexed this amount to inflation for the first time, and 2026 marks the first year the adjustment has been triggered. Total maximum IRA contribution for those 50 and older: $8,600 in 2026. Note that this limit is combined across all personal IRAs — traditional and Roth together.

Roth IRAs

Who is eligible. Eligibility to contribute directly to a Roth IRA is subject to income limits. For 2026, the ability to contribute begins to phase out at:

  • Single filers: $153,000, and is eliminated at $168,000 (up from $150,000–$165,000 in 2025)
  • Married filing jointly: $242,000, and is eliminated at $252,000 (up from $236,000–$246,000 in 2025)

High earners who exceed these thresholds are not permitted to make direct Roth IRA contributions. However, there is no income limit on Roth conversions — and the so-called “backdoor Roth” strategy, which involves making a non-deductible traditional IRA contribution and then immediately converting it to a Roth IRA, remains available. This strategy works most cleanly when you do not have significant pre-tax IRA balances elsewhere (due to the “pro-rata rule” that applies to conversions).

Tax benefits. Roth IRA contributions are made with after-tax dollars, so there is no upfront deduction. The benefit comes on the back end: qualified withdrawals in retirement are entirely tax-free, including all investment growth. The Roth IRA is also not subject to Required Minimum Distributions during the account owner’s lifetime, which gives it significant advantages both for tax planning in retirement and for legacy purposes.

Importantly, Roth IRA contributions (not earnings) can be withdrawn at any time, for any reason, without taxes or penalties — providing a degree of flexibility that other retirement accounts do not.

2025 vs. 2026 contribution limits. The same increases apply as with the traditional IRA: $7,500 in 2026 (up from $7,000 in 2025), with a catch-up of $1,100 (up from $1,000). Again, this limit is shared across all personal IRAs combined.

2026 Contribution Limits at a Glance

Note: 401(k) and 403(b) catch-up contributions for employees age 50+ earning more than $150,000 in FICA wages in prior year must be made as Roth (after-tax) beginning in 2026 under SECURE 2.0. Source: Moore Financial Advisors

Part II: Putting It Together — Three Case Studies

The accounts described in Part I are most useful when you can see how they work together for a real family.

The three scenarios below all share a common profile: the couple is married and filing jointly. Spouse 1 works for a company that offers both a 401(k) plan and an HSA-eligible High-Deductible Health Plan. Spouse 2 earns income as an independent contractor. And in each case, the couple is targeting retirement savings equal to 10% of their gross household income.

The income level, age, and proximity to retirement vary meaningfully across the three scenarios — and so does the optimal strategy.

Scenario 1: Building the Foundation

25 Years from Retirement • Household Income: $225,000 • Savings Target: $22,500

The income picture. Let’s assume Spouse 1 earns $150,000 in W-2 income, and Spouse 2 earns $75,000 as an independent contractor. The couple files jointly with a combined MAGI of $225,000 — which sits comfortably below the 2026 Roth IRA phase-out threshold of $242,000. That is an important and somewhat time-sensitive window: both spouses are eligible for direct Roth IRA contributions, and at age 40 they have 25 years or more for those contributions to compound entirely tax-free.

Spouse 1 — Roth 401(k) and HSA. Spouse 1 does not need to max out the 401(k) to hit the household savings target — but the type of contribution matters. Because they have 25 years until retirement and are still in a moderate tax bracket, the Roth 401(k) is the preferred vehicle: contributions are after-tax today, but every dollar of growth over the next quarter-century and into retirement will be completely tax-free at withdrawal.

The HSA deserves equal emphasis. With a 25-year time horizon, the HSA should be thought of not as a medical spending account, but as a stealth retirement account with a triple tax advantage. If the couple enrolls in a qualifying HDHP and maximizes the family HSA contribution of $8,750, and pays their current medical expenses out of pocket, those dollars can grow tax-free for decades and eventually can be used tax-free for healthcare in retirement — when medical costs tend to be at their highest.

Spouse 2 — Roth IRA. For Spouse 2, the most straightforward path is a direct Roth IRA contribution. At $225,000 combined income, they qualify. The maximum contribution in 2026 is $7,500, and like the Roth 401(k) for Spouse 1, the 25-year compounding window makes the Roth treatment highly attractive. If Spouse 2 is looking to save more, a SEP IRA offers significant additional capacity — up to approximately 20% of net self-employment income, or roughly $14,000–$15,000 in this income range.

However, SEP IRA contributions are pre-tax and add to traditional IRA balances, which creates future RMD obligations. For a 40-year-old, building Roth assets now is generally the stronger long-term choice.

Reaching the $22,500 target:

  • Spouse 1, Roth 401(k): $6,250
  • Family HSA: $8,750
  • Spouse 2, Roth IRA: $7,500
  • Total: $22,500

Key insight. This couple is in a genuinely fortunate position: high enough income to save meaningfully, but still within the Roth IRA eligibility range. As income grows over the coming years, Roth IRA access may phase out, making direct contributions unavailable. Building future tax free assets aggressively now — in the 401(k), the Roth IRA, and the HSA — is a strategy that will pay dividends for decades.

Scenario 2: The Final Push

5 Years from Retirement • Household Income: $500,000 • Savings Target: $50,000

The income picture. Let’s assume Spouse 1 earns $300,000 in W-2 income, and Spouse 2 earns $200,000 as an independent contractor. Both are in the 60–63 age window. The combined MAGI of $500,000 places them well above the Roth IRA income limit — direct Roth IRA contributions are not available. However, the heightened catch-up contribution limits available to the 60–63 age group, combined with the SEP IRA’s generous ceiling, give this couple significant tax-advantaged savings capacity.

Spouse 1 — 401(k) super catch-up and HSA. At age 62, Spouse 1 is squarely in the super catch-up window. The maximum employee deferral in 2026 is $24,500, and the super catch-up for ages 60–63 is $11,250 — for a total employee contribution of $35,750. Add the family HSA contribution of $8,750 plus the age-55+ HSA catch-up of $1,000, and Spouse 1 alone accounts for $45,500 in tax-advantaged contributions.

There is an important planning note here: because Spouse 1 earned more than $150,000 in FICA wages in the prior year, the SECURE 2.0 Roth catch-up rule applies. All catch-up contributions to the 401(k) — the full $11,250 — must be made as Roth (after-tax).

This means no immediate deduction on the catch-up amount, but those dollars will grow and be withdrawn completely tax-free. Given that this couple is likely to be in a high tax bracket throughout retirement, this is not necessarily a disadvantage — but it does affect current-year cash flow planning and should be incorporated into the tax projection for the year.

Also worth noting: with only five years remaining before retirement, HSA contributions should continue to be maximized — but the couple should be aware that HSA contributions must stop when Spouse 1 enrolls in Medicare. If retirement coincides with Medicare enrollment, the HSA contribution window closes.

Spouse 2 — SEP IRA and backdoor Roth. With $200,000 in gross self-employment income, Spouse 2’s SEP IRA capacity is substantial. After the self-employment tax deduction, net self-employment income is approximately $186,000, and 20% of that produces an allowable SEP contribution of roughly $37,000. This provides a powerful pre-tax deduction on a significant portion of Spouse 2’s self-employment income.

At this income level, a direct Roth IRA contribution is not available — but the backdoor Roth strategy may still be viable. The mechanics involve making a non-deductible $7,500 contribution to a traditional IRA and immediately converting it to a Roth IRA.

The key consideration here is the pro-rata rule: if Spouse 2 has other pre-tax IRA balances (such as from a prior rollover), the conversion will be partially taxable. If the SEP IRA holds significant pre-tax assets, the backdoor Roth becomes considerably less attractive — this is a scenario that warrants careful tax modeling before proceeding.

Reaching the $50,000 target. The remarkable thing about this scenario is that Spouse 1’s contributions alone — $45,500 — nearly cover the entire household savings target. Adding even a modest SEP IRA contribution from Spouse 2 easily surpasses $50,000.

  • Spouse 1, 401(k) base deferral: $24,500
  • Spouse 1, super catch-up (ages 60–63, Roth): $11,250
  • Family HSA (+ age-55 catch-up): $9,750
  • Spouse 2, SEP IRA: $4,500 (minimum to reach target)
  • Total: $50,000

Key insight. This couple’s actual tax-advantaged savings capacity far exceeds their 10% target. The SEP IRA alone could shelter an additional $30,000+ of self-employment income. In the five years before retirement, maximizing pre-tax deductions now — while simultaneously building Roth assets through the mandatory Roth catch-up — positions the couple with diversified tax exposure in retirement. That tax diversification, between taxable and tax-free income sources, will give them meaningful flexibility to manage their tax bracket after they stop working.

Scenario 3: Extending the Runway

Spouse 1 Retired • Spouse 2 Still Working • Household Earned Income: $75,000 • Savings Target: $7,500

The income picture. This scenario is different in kind from the first two. Spouse 1 is retired — perhaps drawing from a pension or investment portfolio — and has no earned income. Spouse 2 is still working as an independent contractor, earning $75,000. The household’s total earned income — the figure that governs retirement account eligibility and contribution limits — is Spouse 2’s $75,000 alone.

The couple’s combined MAGI is well below the Roth IRA income phase-out threshold, which means both Roth IRA strategies and Roth conversions carry a favorable tax cost.

Spouse 1 — The spousal IRA. Although Spouse 1 has no earned income of their own, a spousal IRA allows Spouse 2’s earned income to fund a contribution on Spouse 1’s behalf. As long as the couple files jointly and Spouse 2 has sufficient earned income, Spouse 1 can contribute up to $7,500 — or $8,600 with the catch-up if age 50 or older — to either a traditional or Roth IRA in their own name.

At the income level in this scenario, a Roth IRA is the recommended choice for Spouse 1. The current tax rate is likely lower than it will be if and when larger RMDs kick in from pre-tax accounts. Every dollar contributed to the Roth IRA now will grow and be withdrawn tax-free. There are no RMDs on a Roth IRA during the account owner’s lifetime, which provides additional planning flexibility.

The Roth conversion opportunity. This scenario also presents one of the most powerful Roth conversion windows available: the period after one spouse has retired but before RMDs begin and Social Security is claimed at its full level.

If Spouse 1 has significant pre-tax balances in a former employer’s 401(k) or in traditional IRAs, the gap years of early retirement — when taxable income is lower — are an ideal time to convert portions of those accounts to Roth IRAs. For a more detailed discussion of this strategy, including the interaction with Social Security and Medicare premiums, please see our April 2026 article on Roth conversions.

Spouse 2 — SEP IRA and Roth IRA. Spouse 2 has two natural vehicles: a SEP IRA for the immediate tax deduction on self-employment income, and a Roth IRA for tax-free future growth.

The maximum SEP contribution here is approximately 20% of net self-employment income — roughly $14,000 at this income level. Since the household savings target is $7,500, Spouse 2 does not need to maximize the SEP IRA; instead, the question is how to split the contribution between tax-deferred (SEP) and tax-free (Roth).

If Spouse 2 is enrolled in a qualifying HDHP and is not yet on Medicare, an individual HSA contribution of $4,400 (plus $1,000 if age 55 or older) is also available, offering additional tax-advantaged capacity.

Reaching the $7,500 target:

  • Spouse 1, spousal Roth IRA: $7,500 (or $8,600 with catch-up)
  • Spouse 2, Roth IRA: Additional $7,500 if desired (funded by Spouse 2’s earned income)
  • Spouse 2, SEP IRA: Optional — for additional tax deduction on self-employment income beyond the 10% target

To meet just the $7,500 target, the simplest path is a single spousal Roth IRA contribution for Spouse 1. But this couple has the capacity to do considerably more if they wish — and given the favorable income level and tax environment, doing more in Roth form is likely to serve them well.

Key insight. This scenario illustrates something that surprises many clients: a retired spouse can still build retirement savings, as long as the other spouse has earned income and the couple files jointly.

The spousal IRA is underused and underappreciated. Combined with the Roth conversion opportunity that retirement creates — often a multi-year window of lower taxable income before RMDs and Social Security crowd the picture — this couple has the tools to meaningfully strengthen their tax position in retirement, even on a modest income.

Closing Thoughts

The 2026 contribution limit increases are welcome news — they give savers a bit more room. But the greater opportunity lies in understanding how these accounts work together. A 401(k) and an HSA and a Roth IRA and a SEP IRA are not competing options. For the right family, they are complementary layers of a single, coherent strategy — each account doing a specific job, in a specific tax “bucket,” for a specific purpose.

The right combination for your family depends on your income, your employment situation, your age, your proximity to retirement, and your tax picture today versus what you expect it to be in the future. There is no one-size-fits-all answer — which is exactly why we model these decisions individually, account by account, year by year.

If you have not recently reviewed how your current contributions are structured, or if your situation has changed — a new job, a shift to self-employment, a spouse entering or leaving the workforce, or an approaching retirement — this is an ideal time for a conversation. We are here to help you make the most of every dollar you put to work for your future.

April 2026 Market Recap: One Strong Month

April proved to be an exceptionally strong month for the stock market.

The month opened against the backdrop of an active shooting war, a nearly closed Strait of Hormuz, record oil prices, and a consumer confidence reading at an all-time low. Despite these concerns, stocks powered forward setting new all-time highs.

April was defined by three themes: diplomacy; an earnings season that delivered; and artificial intelligence producing revenue results for big technology companies.

The first theme was diplomacy — messy, uncertain, but seeming to trend in the right direction, from a financial markets standpoint.

April’s arc ran from President Trump threatening to knock out “every power plant and every bridge” in Iran, to a Pakistan-brokered ceasefire, to Iran briefly opening the Strait and then closing it again, to a revised Iranian proposal arriving through mediators on the final day of the month.

None of it was clean, and no permanent deal was reached. But markets are forward-looking, and as each week passed, the probability of catastrophic escalation fell while the probability of an eventual resolution rose. That directional shift — even without a final outcome — was enough to send stocks marching to new all-time highs.

The second theme was an earnings season that delivered, broadly and convincingly.

By month’s end, roughly 87% of S&P 500 companies that reported had beaten Wall Street analysts’ earnings estimates, with first-quarter profit growth tracking above 13% year-over-year.

A few of the standouts:

  • Intel posted the largest earnings surprise — as a percentage — ever recorded for a major index component, sending the stock up 23% in a single session
  • Caterpillar stock jumped 10% on a blowout quarter and raised full-year guidance
  • Apple closed the season with record iPhone and Services revenue, announcing a $100 billion stock buyback, and Q3 guidance more than double what analysts had expected

The message from corporate America was consistent and clear: revenue and profits are generally on an upward trend and business is resilient.

The third theme was artificial intelligence — not as a concept, but as a revenue reality.

Several of the largest technology companies in the world showed impressive financial results related to AI infrastructure: Google Cloud grew 63% year-over-year, Microsoft’s Azure accelerated to 40% growth, and Amazon Web Services posted its fastest growth rate in 15 quarters. These were not promises about future potential — they were current-quarter revenue numbers from businesses already running at tens of billions of dollars in annual revenue.

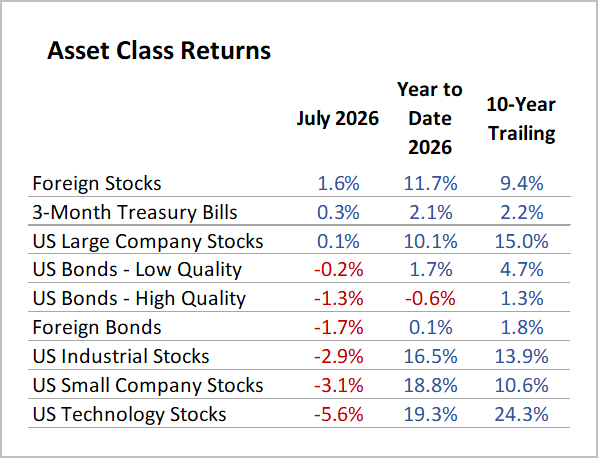
Here are results for April and 2026 Year-to-Date, compared to longer-term annualized returns (10-Year Trailing):

Note: YTD 2026 as of 4/30/2026; Source: Morningstar

How to Be More Tree

How to Be More Tree: Essential Life Lessons for Perennial Happiness by Liz Marvin uses the quiet wisdom of trees as a metaphor for living a calmer, more resilient, and more joyful life.

Through short, beautifully illustrated reflections, Marvin encourages readers to adopt tree-like qualities—such as rootedness, patience, adaptability, and generosity—to navigate stress and uncertainty with greater ease.

The book blends gentle philosophy with practical life lessons, reminding us to slow down, grow at our own pace, weather life’s seasons, and stay connected to others and the natural world.

Marvin’s uplifting meditation on finding lasting happiness by being steady, present, and resilient—just like a tree—seems appropriate, too, for those who celebrate Earth Day on April 22.

College Decision Day 2026:What to Consider Before Committing to a School

As a financial advisor and college planner, along with my experience working at a universities, I have helped hundreds of families leading up to the final stretch to make it to Decision Day- May 1st.

It is exciting for sure, however, it can feel overwhelming! Students are making the crucial decision of where they will spend the next four years, and parents are planning for this significant investment.

Here is a guide to help students and parents make a confident, well-balanced choice—emotionally and financially.

1.     Look Beyond the Sticker Price—Focus on What You’ll Actually Pay

When comparing colleges, don’t get distracted by the published tuition number. What matters is the net price, which is:

  • Total cost
  • minus
  • Grants and scholarships (free money)

If two colleges feel similar, the financial structure often becomes the real deciding factor.

2.     Consider the “2026 College Fit” Instead of the Dream from Five Years Ago

The world has changed quickly—so the idea of the “perfect” college might have, too. Encourage your student to evaluate:

  • Career pathways in a world shifting toward AI and automation
  • Majors with strong workforce demand and internships
  • Updated ROI data showing employment rates and average salaries
  • Campus culture, safety, and academic support

Your student isn’t choosing the best college in general—they’re choosing the best college for who they are becoming now. Parents are considering the best financial fit at the same time.

3.     Don’t Rely on the Waitlist- Be Sure to Have an Overall Plan to Secure Enrollment

Many colleges have been using waitlists heavily in recent years and that will continue due to uncertain enrollment. However, students should have a plan that includes other options:

  • Only accept a waitlist spot if you are sure you would attend
  • Still pay a deposit at a school you are sure is a good fit and would be excited to attend
  • Prepare for a potential long wait to hear about waitlists—it could be summertime that you get a notification

4.     Well-Being Should be a Priority for Students- It Matters More Than Ever

Heading off to college is a big transition. It is crucial to be in a community with a strong support system.

Consider these items:

  • Availability of mental health services and counseling both on and off-campus
  • Academic support (tutoring centers, advising, peer mentoring)
  • Disability or accommodation resources, if needed
  • Residence life safety and structure
  • The feel of the student community—supportive vs. competitive

5.     Check the Small Details: Deposits, Housing, and Important Deadlines

  • Deposit deadlines and refund policies
  • Whether freshmen are guaranteed housing
  • Honors program or scholarship requirements
  • Orientation/registration dates (the earlier, the better)
  • The timeline to submit final transcripts and immunization records

6.     Have The Conversation: “How Are We Paying for College?”

Being open and having a transparent discussion on financing college can reduce stress and help you make an informed and financially feasible decision.

  • Look at any surplus monthly cash flow that can be used to make monthly payments
  • If you are considering loans- look at all the details: Federal student loans, parent loans and private loans. Know the totals you are expecting to borrow and if they are realistic.
  • Look at the student’s potential salary after graduation—is the debt you are considering reasonable?
  • Discuss the student working part-time during school and summers
  • How does the overall college expense affect long-term planning for the family such as retirement goals?

What’s Next?

Maybe the most important step in this long journey—When you make the choice and pay that deposit, it is time to celebrate!

Take a deep breath: Wear the merch, send out notifications to friends and family and enjoy this moment knowing you did your best to prepare for this Decision Day!

Should You Convert to a Roth? What Every Client Should Know

Few strategies in retirement planning generate as much discussion — or as much confusion — as the Roth IRA conversion.

Used wisely, a Roth conversion can meaningfully improve your long-term financial picture. Used carelessly, it can trigger an unexpected tax bill, higher Medicare premiums, and greater taxation of your Social Security benefits.

In this article, we walk through the essential considerations so you can approach this topic as an informed participant in your financial plan.

What Is a Roth Conversion?

A Roth conversion involves moving money from a tax-deferred account — such as a traditional IRA, 401(k), or 403(b) — into a Roth IRA.

The key trade-off is straightforward: you pay ordinary income tax on the amount converted today, in exchange for tax-free growth and tax-free withdrawals in the future.

Unlike a traditional IRA, a Roth IRA is not subject to required minimum distributions (RMDs) during the account owner’s lifetime, and qualified distributions are entirely income tax-free.

Anyone can execute a Roth conversion, regardless of income level. This is an important distinction: while high earners are prohibited from contributing directly to a Roth IRA above certain income thresholds, there is no income limit on conversions.

The Long-Term Case for Roth Conversions

The merits of Roth conversions are most compelling when viewed through a long-term lens. Here is why:

  • Tax-free compounding. Once funds are in a Roth IRA, all future growth is sheltered from income tax. For accounts that have decades to compound, this can translate into a substantially larger tax-free inheritance for you and your heirs.
  • RMD reduction. Traditional IRAs and pre-tax 401(k)s require you to take minimum distributions beginning at age 73, whether you need the money or not. These distributions are taxable as ordinary income, which can push you into higher tax brackets, increase the taxation of your Social Security benefits, and trigger higher Medicare premiums. Converting a portion of your pre-tax accounts to Roth reduces the size of your future RMDs — and the tax drag that comes with them.
  • Tax diversification. Having both taxable and tax-free income sources in retirement gives you far more flexibility to manage your tax bracket from year to year. Rather than being forced to draw entirely from taxable accounts, you can blend Roth withdrawals with other income to stay below critical thresholds.
  • Legacy planning. Roth IRAs can be powerful estate planning tools. Heirs who inherit Roth accounts receive income-tax-free assets, which can be especially valuable if they are in high tax brackets themselves.
  • Protection against future tax rate increases. Current federal income tax rates are historically moderate. Many financial planners believe rates will need to rise in the future to address long-term fiscal pressures. Converting at today’s rates locks in your tax bill before potential future increases.

When Are Roth Conversions Most Beneficial?

Timing is everything with Roth conversions. The goal is always to convert at the lowest possible tax cost. The following windows tend to be most advantageous:

  • The “gap years” — between retirement and age 73. This is the single most powerful window for most clients. If you retire at 62 or 65 but delay Social Security and have not yet begun RMDs, your taxable income may be the lowest it will ever be for the rest of your life. This creates an opportunity to fill up lower tax brackets — such as the 12% or 22% bracket — with conversion income before RMDs, Social Security, and other income layers crowd that space out permanently.
  • Before Social Security begins. As we explain in more detail below, once Social Security begins, each dollar of Roth conversion income can cause additional Social Security benefits to become taxable. Converting before benefits begin avoids this compounding tax effect.
  • Low-income years. A job loss, sabbatical, business down year, or large deductible expense (such as significant medical costs) can create a temporary window where your income is unusually low. These are excellent conversion opportunities.
  • After a market decline. If your IRA has declined in value, converting at the lower balance means paying tax on a smaller amount. When the market recovers, those gains accumulate tax-free inside the Roth.
  • Before ages 63–64 (for those approaching Medicare). Because Medicare uses a two-year lookback to determine your income-related surcharges (IRMAA — explained below), front-loading conversions before age 63 or 64 can reduce or eliminate future IRMAA exposure. Once you are on Medicare, large conversions must be carefully calibrated to avoid crossing IRMAA brackets.

The Social Security “Crowding Out” Issue

One of the most underappreciated complications of Roth conversions is their interaction with Social Security benefits. This is an important point for clients who are receiving Social Security but with little or no other income.

A Roth conversion amount gets added directly to Adjusted Gross Income, which impacts whether Social Security benefits are taxed at 0%, 50%, or 85%.

When you receive Social Security, the IRS uses a figure called provisional income (also known as “combined income”) to determine how much of your benefit is taxable.

Provisional income includes your adjusted gross income, any tax-exempt interest, and half of your Social Security benefit. If this figure exceeds $25,000 for a single filer or $32,000 for a married couple, a portion of your Social Security becomes taxable — up to 85% at higher income levels.

Here is where conversions become costly after Social Security begins: each dollar you convert to a Roth increases your provisional income, which in turn can cause more of your Social Security benefit to become taxable.

The result is a compounding tax effect — you are effectively taxed on both the conversion amount and on an increased share of your Social Security benefit.

The practical implication: For most clients with significant pre-tax IRA balances, the highest-value Roth conversions happen before Social Security begins, during those “gap years” when income is lower and provisional income is easier to manage.

Once Social Security is in payment, conversions can still make sense, but the amounts should be modeled carefully to avoid triggering this compounding effect inadvertently.

Roth Conversions and Medicare IRMAA

If you are on Medicare — or approaching it — Roth conversions require an additional layer of analysis because of the Income-Related Monthly Adjustment Amount (IRMAA).

IRMAA is a surcharge added to your Medicare Part B and Part D premiums when your Modified Adjusted Gross Income (MAGI) exceeds certain thresholds.

For 2026, IRMAA surcharges begin at $109,000 MAGI for single filers and $218,000 for married couples filing jointly. The surcharges operate on a tiered “cliff” structure, meaning that crossing a threshold by even one dollar can increase your annual Medicare premiums significantly.

The two-year lookback. The critical planning wrinkle is that your 2026 IRMAA is based on your 2024 income — not your current income. This two-year lag means that a large Roth conversion you execute today will not affect your Medicare premiums for another two years.

Conversely, a large conversion you did two years ago may be triggering higher premiums right now.

The numbers are real. In 2026, the IRMAA surcharge for Part B can range from an additional $81.20 to $487.00 per person per month, depending on income tier.

For a married couple both on Medicare, a conversion that pushes income into the next IRMAA bracket could cost more than $1,000 in additional annual Medicare premiums per person — sometimes negating much of the tax benefit of the conversion itself.

What this means for planning. The goal is not to avoid Roth conversions out of fear of IRMAA — it is to convert strategically, staying below IRMAA thresholds where possible, and in amounts that optimize the long-term benefit against the near-term premium cost.

Once Roth conversions are complete and your RMDs are reduced (or eliminated), future Roth withdrawals do not count toward MAGI at all, which can dramatically reduce your long-term IRMAA exposure.

The short-term surcharge, properly weighed, may well be worth the long-term premium savings.

When a Roth Conversion Is Not Recommended

As valuable as this strategy can be, Roth conversions are not universally beneficial. Here are the situations where we would typically advise caution or decline to recommend a conversion:

  • Your tax rate today is higher than you expect in retirement. If you are currently in a high bracket and expect significantly lower income in retirement, deferring taxes makes more sense. Pay taxes later at a lower rate, not more taxes now at a higher one.
  • You cannot pay the tax with outside funds. The best Roth conversions are funded with non-retirement assets — money in a taxable brokerage account or savings — used to pay the tax bill. If you would need to withdraw additional funds from your IRA to cover the tax, the conversion becomes far less efficient and potentially counterproductive.
  • You have a short time horizon. Roth conversions take time to deliver their benefits. If you are in poor health, have a limited life expectancy, or need the funds in the near term, the upfront tax cost may not be recouped.
  • The conversion would trigger an IRMAA tier jump that outweighs the benefit. If a conversion amount would push you over an IRMAA cliff — adding thousands in Medicare premiums over multiple years — the math may not work in your favor, particularly for smaller conversion amounts.
  • The conversion would make a greater portion of Social Security taxable. As discussed above, if you are already receiving Social Security and a conversion would significantly increase the taxable portion of your benefit, the effective tax rate on the conversion may be far higher than it appears.
  • You expect to leave assets to charity. If your primary beneficiary is a charitable organization, keeping funds in a traditional IRA may be preferable — charities pay no income tax on inherited IRAs, so the tax deferral benefits accrue to a tax-exempt entity rather than generating a tax bill for you today.

A Note on Process

Roth conversions require careful coordination between your financial plan and your tax return.

At Moore Financial Advisors, we use financial planning software to model conversion scenarios across multiple years, analyzing the interplay between your tax brackets, RMDs, Social Security, IRMAA, and investment returns.

We recommend working in close collaboration with your CPA or tax advisor, because the final conversion decision and execution must be informed by your complete tax picture for the year.

If you have not recently discussed Roth conversion opportunities with us — particularly if you are approaching retirement or newly retired and have significant pre-tax retirement assets — we encourage you to reach out.

The window for the most tax-efficient conversions is finite, and early, thoughtful planning is far more powerful than later-stage adjustments.

Energizer Economy: Why the Iran War Is Unlikely to Tip the U.S. Into Recession

The U.S.-Israel military campaign against Iran, which began on February 28, has delivered the largest oil supply disruption in the history of global energy markets.

The near-closure of the Strait of Hormuz has removed roughly eight million barrels of oil per day from global supply, sending Brent crude surging from around $70 a barrel before the war to a peak near $120.

Gas prices at the pump have jumped sharply, and forecasters from Goldman Sachs to EY-Parthenon have raised their recession probability estimates — Goldman to 30%, EY-Parthenon to 40%.

These are not trivial numbers. But they also mean that the majority view on Wall Street and among professional economists remains that the U.S. will not enter recession in 2026.

Here is why that is, and why I share that assessment.

1.    The U.S. Is the World’s Largest Oil Producer

This is perhaps the single most important structural difference between today and the oil shocks of the 1970s. When OPEC embargoed oil exports in 1973, the United States was heavily dependent on imported crude. Today, America produces more oil than any other country on earth.

While gas prices are still tied to global benchmarks — oil is a global commodity priced in dollars — the U.S. is meaningfully insulated from the supply shock in ways that Europe and Asia simply are not.

The bulk of Gulf crude exports flow eastward to China, India, Japan and South Korea, not westward to the United States. This asymmetry matters: Europe and Asia bear the brunt of the supply disruption, while the U.S. benefits from domestic production capacity that can partially offset global tightness.

2.    Oil Prices Would Need to Stay Much Higher, Much Longer to Cause a Recession

History shows that oil price shocks cause recessions not through a single spike, but through sustained elevation over time.

Economists at Oxford Economics estimate that every $10 increase in the per-barrel price of oil, sustained over roughly two months, shaves about 0.1% from GDP. At current prices — Brent hovering between $90 and $100 — the drag on U.S. growth is real, but manageable.

Oxford Economics’ modeling finds that the true “breaking point” for the U.S. economy would be oil averaging around $140 per barrel for two months or more.

At that level, spillover effects become much harder to contain and the U.S. would approach, but not necessarily enter, recession. Current prices remain meaningfully below that threshold.

Furthermore, the U.S. Energy Information Administration projects Brent crude will fall back below $80 per barrel by the third quarter of 2026 as global markets adjust — assuming the Strait of Hormuz progressively reopens to traffic.

3.    Powerful Fiscal Stimulus Is Still Working Its Way Through the Economy

The “One Big Beautiful Bill Act,” signed into law in July 2025, represents a substantial injection of fiscal stimulus — one that economists believe will provide meaningful support to growth in 2026 and beyond.

Goldman Sachs estimates that tax refunds tied to the legislation will deliver approximately $100 billion, or about 0.4% of annual disposable income, to consumers in the first half of the year. This puts real money in Americans’ pockets at precisely the moment when higher energy costs are squeezing household budgets.

Corporate tax provisions in the legislation are also giving businesses both the capital and the confidence to invest — particularly in AI infrastructure, which has become a significant and largely energy-cost-independent driver of U.S. economic growth.

4.    AI Investment Is a Durable, War-Resistant Growth Engine

One of the most distinctive features of the current expansion is the role of artificial intelligence investment.

Spending on data centers, software and AI-related infrastructure has become a structural pillar of U.S. economic growth, accounting for roughly half of all investment growth in the first half of 2025 according to the Department of Commerce — compared with just 10% in the first half of 2019.

Critically, this investment is largely immune to oil price fluctuations. Technology companies building data centers and AI systems are not materially affected by the short-term price movements of Brent crude.

This creates a significant cushion in the growth picture that simply did not exist in previous oil-shock eras.

5.    The Federal Reserve Has Room to Act as a Shock Absorber

In 1979, when the second oil shock hit, the Federal Reserve under Paul Volcker responded by raising interest rates sharply to combat inflation — and that policy contributed significantly to the recession that followed.

Today, the situation is different. While the Fed is unlikely to cut rates in the near term given renewed inflationary pressure from energy prices, it also has the flexibility to delay further tightening and to move toward easing if the economy weakens materially.

In short, monetary policy is not working against the economy in the way it did in the early 1980s. The Fed remains a potential stabilizer, not an additional headwind.

6.    The U.S. Labor Market Is Resilient


Perhaps the most powerful near-term indicator that recession is not imminent is the continued resilience of the U.S. labor market — and this week’s data reinforce that picture.

On April 3, the Bureau of Labor Statistics released its March Employment Situation report — the first major jobs report since the Iran war began. The headline number was encouraging: the U.S. economy added 178,000 non-farm payroll jobs in March, with the unemployment rate holding steady at 4.3%.

February’s loss 133,000 jobs was revised to reflect the impact of the Kaiser Permanente nurses’ strike, which has since resolved, and followed a gain of 160,000 jobs in January.

March’s rebound is consistent with the view that much of the prior weakness was transitory rather than structural.

Volatility in the jobs market is something to be mindful of but, at this point, is not indicative of an impending downturn.

What might a jobs market “canary in the coal mine” look like?

The picture below (courtesy of Datatrek) shows monthly US job gains and losses from 1986 through 2019 and highlights the last three recessions – in 1990, 2001, and 2008 – in grey bars.

The start of each of the last three recessions saw three months of consecutive job losses and in each case one month showed employment levels declining by 200,000 workers (the data is called out in red font).

Source: Datatrek and Federal Reserve Economic Data (FRED)

For the situation today, the economy has created an average of about 15,000 jobs each month over the past half year.

That is a big downshift from the same period a year earlier, when the U.S. was adding 78,000 jobs on average each month, but we are still adding jobs, and it’s enough to keep the unemployment rate steady.

Another window on the employment situation in the US is the weekly initial unemployment claims data produced by the Department of Labor.

The latest release, on April 2 showed that for the week ending March 28, seasonally adjusted initial unemployment claims came in at 202,000 — nearly matching the two-year low of 201,000 set in January. The four-week moving average for initial unemployment claims stands at 207,750.

Today’s labor market statistics are not consistent with an economy on the verge of recession.

Historically, initial claims begin to rise meaningfully — typically above 250,000 to 300,000 on a sustained basis — well before a recession is formally declared.

At current levels, the data show that employers are simply not laying off workers at a pace that signals economic distress.

This is the crucial dynamic: recessions are generally caused not by rising prices alone, but by rising prices combined with rising unemployment. When workers lose their jobs, they cut spending, businesses respond by cutting more jobs, and the cycle feeds on itself.

That negative feedback loop requires a deteriorating labor market to get started — and right now, the labor market is not deteriorating. Employers appear to be choosing to hold on to their workforce even as energy costs rise, absorbing some margin pressure rather than triggering layoffs.

Until weekly unemployment claims begin trending meaningfully higher, the unemployment rate climbs toward 5%, or monthly payroll additions turn consistently negative, the labor market will remain an important shock absorber for the US economy.

What We Are Watching

None of this means the risks are trivial. We are monitoring three variables closely:

  • The duration of Strait of Hormuz disruptions. A prolonged closure — measured in months rather than weeks — would change the calculus significantly. If oil prices average $140 or above into the summer, recession risk rises sharply.
  • Consumer spending. Energy costs are effectively a tax on households, and if they cause consumers to meaningfully pull back on discretionary spending, the resulting slowdown in business activity and hiring could become self-reinforcing.
  • Inflation persistence. If the oil shock pushes headline inflation durably above 4%, the Fed’s room to maneuver shrinks and the stagflation scenario becomes more credible.

The Bottom Line

The Iran war has made 2026 a more difficult year for the U.S. economy. Growth will be slower than it might otherwise have been, inflation will be stickier, and uncertainty is elevated.

But the U.S. enters this challenge with significant structural advantages: energy self-sufficiency, fiscal momentum, an AI-driven investment boom that seems to be durable, and a Federal Reserve that retains meaningful flexibility.

History tells us that oil shocks cause recessions when they are severe, sustained, and met with policy that amplifies rather than cushions the blow. None of those three conditions are clearly in place today.

As I was writing this article, the tagline for the ad campaign for Energizer batteries came to mind: “still going”.

Despite a foreign conflict with wide-ranging implications, including grave concerns by many US consumers and a current sky-high oil price, the US economy is still going.

While the risks to an economic downturn are significantly higher now than they were before February 28, my sense is that the U.S. economy will navigate this shock without entering recession in 2026.