Category

Should You Convert to a Roth? What Every Client Should Know

Few strategies in retirement planning generate as much discussion — or as much confusion — as the Roth IRA conversion.

Used wisely, a Roth conversion can meaningfully improve your long-term financial picture. Used carelessly, it can trigger an unexpected tax bill, higher Medicare premiums, and greater taxation of your Social Security benefits.

In this article, we walk through the essential considerations so you can approach this topic as an informed participant in your financial plan.

What Is a Roth Conversion?

A Roth conversion involves moving money from a tax-deferred account — such as a traditional IRA, 401(k), or 403(b) — into a Roth IRA.

The key trade-off is straightforward: you pay ordinary income tax on the amount converted today, in exchange for tax-free growth and tax-free withdrawals in the future.

Unlike a traditional IRA, a Roth IRA is not subject to required minimum distributions (RMDs) during the account owner’s lifetime, and qualified distributions are entirely income tax-free.

Anyone can execute a Roth conversion, regardless of income level. This is an important distinction: while high earners are prohibited from contributing directly to a Roth IRA above certain income thresholds, there is no income limit on conversions.

The Long-Term Case for Roth Conversions

The merits of Roth conversions are most compelling when viewed through a long-term lens. Here is why:

  • Tax-free compounding. Once funds are in a Roth IRA, all future growth is sheltered from income tax. For accounts that have decades to compound, this can translate into a substantially larger tax-free inheritance for you and your heirs.
  • RMD reduction. Traditional IRAs and pre-tax 401(k)s require you to take minimum distributions beginning at age 73, whether you need the money or not. These distributions are taxable as ordinary income, which can push you into higher tax brackets, increase the taxation of your Social Security benefits, and trigger higher Medicare premiums. Converting a portion of your pre-tax accounts to Roth reduces the size of your future RMDs — and the tax drag that comes with them.
  • Tax diversification. Having both taxable and tax-free income sources in retirement gives you far more flexibility to manage your tax bracket from year to year. Rather than being forced to draw entirely from taxable accounts, you can blend Roth withdrawals with other income to stay below critical thresholds.
  • Legacy planning. Roth IRAs can be powerful estate planning tools. Heirs who inherit Roth accounts receive income-tax-free assets, which can be especially valuable if they are in high tax brackets themselves.
  • Protection against future tax rate increases. Current federal income tax rates are historically moderate. Many financial planners believe rates will need to rise in the future to address long-term fiscal pressures. Converting at today’s rates locks in your tax bill before potential future increases.

When Are Roth Conversions Most Beneficial?

Timing is everything with Roth conversions. The goal is always to convert at the lowest possible tax cost. The following windows tend to be most advantageous:

  • The “gap years” — between retirement and age 73. This is the single most powerful window for most clients. If you retire at 62 or 65 but delay Social Security and have not yet begun RMDs, your taxable income may be the lowest it will ever be for the rest of your life. This creates an opportunity to fill up lower tax brackets — such as the 12% or 22% bracket — with conversion income before RMDs, Social Security, and other income layers crowd that space out permanently.
  • Before Social Security begins. As we explain in more detail below, once Social Security begins, each dollar of Roth conversion income can cause additional Social Security benefits to become taxable. Converting before benefits begin avoids this compounding tax effect.
  • Low-income years. A job loss, sabbatical, business down year, or large deductible expense (such as significant medical costs) can create a temporary window where your income is unusually low. These are excellent conversion opportunities.
  • After a market decline. If your IRA has declined in value, converting at the lower balance means paying tax on a smaller amount. When the market recovers, those gains accumulate tax-free inside the Roth.
  • Before ages 63–64 (for those approaching Medicare). Because Medicare uses a two-year lookback to determine your income-related surcharges (IRMAA — explained below), front-loading conversions before age 63 or 64 can reduce or eliminate future IRMAA exposure. Once you are on Medicare, large conversions must be carefully calibrated to avoid crossing IRMAA brackets.

The Social Security “Crowding Out” Issue

One of the most underappreciated complications of Roth conversions is their interaction with Social Security benefits. This is an important point for clients who are receiving Social Security but with little or no other income.

A Roth conversion amount gets added directly to Adjusted Gross Income, which impacts whether Social Security benefits are taxed at 0%, 50%, or 85%.

When you receive Social Security, the IRS uses a figure called provisional income (also known as “combined income”) to determine how much of your benefit is taxable.

Provisional income includes your adjusted gross income, any tax-exempt interest, and half of your Social Security benefit. If this figure exceeds $25,000 for a single filer or $32,000 for a married couple, a portion of your Social Security becomes taxable — up to 85% at higher income levels.

Here is where conversions become costly after Social Security begins: each dollar you convert to a Roth increases your provisional income, which in turn can cause more of your Social Security benefit to become taxable.

The result is a compounding tax effect — you are effectively taxed on both the conversion amount and on an increased share of your Social Security benefit.

The practical implication: For most clients with significant pre-tax IRA balances, the highest-value Roth conversions happen before Social Security begins, during those “gap years” when income is lower and provisional income is easier to manage.

Once Social Security is in payment, conversions can still make sense, but the amounts should be modeled carefully to avoid triggering this compounding effect inadvertently.

Roth Conversions and Medicare IRMAA

If you are on Medicare — or approaching it — Roth conversions require an additional layer of analysis because of the Income-Related Monthly Adjustment Amount (IRMAA).

IRMAA is a surcharge added to your Medicare Part B and Part D premiums when your Modified Adjusted Gross Income (MAGI) exceeds certain thresholds.

For 2026, IRMAA surcharges begin at $109,000 MAGI for single filers and $218,000 for married couples filing jointly. The surcharges operate on a tiered “cliff” structure, meaning that crossing a threshold by even one dollar can increase your annual Medicare premiums significantly.

The two-year lookback. The critical planning wrinkle is that your 2026 IRMAA is based on your 2024 income — not your current income. This two-year lag means that a large Roth conversion you execute today will not affect your Medicare premiums for another two years.

Conversely, a large conversion you did two years ago may be triggering higher premiums right now.

The numbers are real. In 2026, the IRMAA surcharge for Part B can range from an additional $81.20 to $487.00 per person per month, depending on income tier.

For a married couple both on Medicare, a conversion that pushes income into the next IRMAA bracket could cost more than $1,000 in additional annual Medicare premiums per person — sometimes negating much of the tax benefit of the conversion itself.

What this means for planning. The goal is not to avoid Roth conversions out of fear of IRMAA — it is to convert strategically, staying below IRMAA thresholds where possible, and in amounts that optimize the long-term benefit against the near-term premium cost.

Once Roth conversions are complete and your RMDs are reduced (or eliminated), future Roth withdrawals do not count toward MAGI at all, which can dramatically reduce your long-term IRMAA exposure.

The short-term surcharge, properly weighed, may well be worth the long-term premium savings.

When a Roth Conversion Is Not Recommended

As valuable as this strategy can be, Roth conversions are not universally beneficial. Here are the situations where we would typically advise caution or decline to recommend a conversion:

  • Your tax rate today is higher than you expect in retirement. If you are currently in a high bracket and expect significantly lower income in retirement, deferring taxes makes more sense. Pay taxes later at a lower rate, not more taxes now at a higher one.
  • You cannot pay the tax with outside funds. The best Roth conversions are funded with non-retirement assets — money in a taxable brokerage account or savings — used to pay the tax bill. If you would need to withdraw additional funds from your IRA to cover the tax, the conversion becomes far less efficient and potentially counterproductive.
  • You have a short time horizon. Roth conversions take time to deliver their benefits. If you are in poor health, have a limited life expectancy, or need the funds in the near term, the upfront tax cost may not be recouped.
  • The conversion would trigger an IRMAA tier jump that outweighs the benefit. If a conversion amount would push you over an IRMAA cliff — adding thousands in Medicare premiums over multiple years — the math may not work in your favor, particularly for smaller conversion amounts.
  • The conversion would make a greater portion of Social Security taxable. As discussed above, if you are already receiving Social Security and a conversion would significantly increase the taxable portion of your benefit, the effective tax rate on the conversion may be far higher than it appears.
  • You expect to leave assets to charity. If your primary beneficiary is a charitable organization, keeping funds in a traditional IRA may be preferable — charities pay no income tax on inherited IRAs, so the tax deferral benefits accrue to a tax-exempt entity rather than generating a tax bill for you today.

A Note on Process

Roth conversions require careful coordination between your financial plan and your tax return.

At Moore Financial Advisors, we use financial planning software to model conversion scenarios across multiple years, analyzing the interplay between your tax brackets, RMDs, Social Security, IRMAA, and investment returns.

We recommend working in close collaboration with your CPA or tax advisor, because the final conversion decision and execution must be informed by your complete tax picture for the year.

If you have not recently discussed Roth conversion opportunities with us — particularly if you are approaching retirement or newly retired and have significant pre-tax retirement assets — we encourage you to reach out.

The window for the most tax-efficient conversions is finite, and early, thoughtful planning is far more powerful than later-stage adjustments.

Energizer Economy: Why the Iran War Is Unlikely to Tip the U.S. Into Recession

The U.S.-Israel military campaign against Iran, which began on February 28, has delivered the largest oil supply disruption in the history of global energy markets.

The near-closure of the Strait of Hormuz has removed roughly eight million barrels of oil per day from global supply, sending Brent crude surging from around $70 a barrel before the war to a peak near $120.

Gas prices at the pump have jumped sharply, and forecasters from Goldman Sachs to EY-Parthenon have raised their recession probability estimates — Goldman to 30%, EY-Parthenon to 40%.

These are not trivial numbers. But they also mean that the majority view on Wall Street and among professional economists remains that the U.S. will not enter recession in 2026.

Here is why that is, and why I share that assessment.

1.    The U.S. Is the World’s Largest Oil Producer

This is perhaps the single most important structural difference between today and the oil shocks of the 1970s. When OPEC embargoed oil exports in 1973, the United States was heavily dependent on imported crude. Today, America produces more oil than any other country on earth.

While gas prices are still tied to global benchmarks — oil is a global commodity priced in dollars — the U.S. is meaningfully insulated from the supply shock in ways that Europe and Asia simply are not.

The bulk of Gulf crude exports flow eastward to China, India, Japan and South Korea, not westward to the United States. This asymmetry matters: Europe and Asia bear the brunt of the supply disruption, while the U.S. benefits from domestic production capacity that can partially offset global tightness.

2.    Oil Prices Would Need to Stay Much Higher, Much Longer to Cause a Recession

History shows that oil price shocks cause recessions not through a single spike, but through sustained elevation over time.

Economists at Oxford Economics estimate that every $10 increase in the per-barrel price of oil, sustained over roughly two months, shaves about 0.1% from GDP. At current prices — Brent hovering between $90 and $100 — the drag on U.S. growth is real, but manageable.

Oxford Economics’ modeling finds that the true “breaking point” for the U.S. economy would be oil averaging around $140 per barrel for two months or more.

At that level, spillover effects become much harder to contain and the U.S. would approach, but not necessarily enter, recession. Current prices remain meaningfully below that threshold.

Furthermore, the U.S. Energy Information Administration projects Brent crude will fall back below $80 per barrel by the third quarter of 2026 as global markets adjust — assuming the Strait of Hormuz progressively reopens to traffic.

3.    Powerful Fiscal Stimulus Is Still Working Its Way Through the Economy

The “One Big Beautiful Bill Act,” signed into law in July 2025, represents a substantial injection of fiscal stimulus — one that economists believe will provide meaningful support to growth in 2026 and beyond.

Goldman Sachs estimates that tax refunds tied to the legislation will deliver approximately $100 billion, or about 0.4% of annual disposable income, to consumers in the first half of the year. This puts real money in Americans’ pockets at precisely the moment when higher energy costs are squeezing household budgets.

Corporate tax provisions in the legislation are also giving businesses both the capital and the confidence to invest — particularly in AI infrastructure, which has become a significant and largely energy-cost-independent driver of U.S. economic growth.

4.    AI Investment Is a Durable, War-Resistant Growth Engine

One of the most distinctive features of the current expansion is the role of artificial intelligence investment.

Spending on data centers, software and AI-related infrastructure has become a structural pillar of U.S. economic growth, accounting for roughly half of all investment growth in the first half of 2025 according to the Department of Commerce — compared with just 10% in the first half of 2019.

Critically, this investment is largely immune to oil price fluctuations. Technology companies building data centers and AI systems are not materially affected by the short-term price movements of Brent crude.

This creates a significant cushion in the growth picture that simply did not exist in previous oil-shock eras.

5.    The Federal Reserve Has Room to Act as a Shock Absorber

In 1979, when the second oil shock hit, the Federal Reserve under Paul Volcker responded by raising interest rates sharply to combat inflation — and that policy contributed significantly to the recession that followed.

Today, the situation is different. While the Fed is unlikely to cut rates in the near term given renewed inflationary pressure from energy prices, it also has the flexibility to delay further tightening and to move toward easing if the economy weakens materially.

In short, monetary policy is not working against the economy in the way it did in the early 1980s. The Fed remains a potential stabilizer, not an additional headwind.

6.    The U.S. Labor Market Is Resilient


Perhaps the most powerful near-term indicator that recession is not imminent is the continued resilience of the U.S. labor market — and this week’s data reinforce that picture.

On April 3, the Bureau of Labor Statistics released its March Employment Situation report — the first major jobs report since the Iran war began. The headline number was encouraging: the U.S. economy added 178,000 non-farm payroll jobs in March, with the unemployment rate holding steady at 4.3%.

February’s loss 133,000 jobs was revised to reflect the impact of the Kaiser Permanente nurses’ strike, which has since resolved, and followed a gain of 160,000 jobs in January.

March’s rebound is consistent with the view that much of the prior weakness was transitory rather than structural.

Volatility in the jobs market is something to be mindful of but, at this point, is not indicative of an impending downturn.

What might a jobs market “canary in the coal mine” look like?

The picture below (courtesy of Datatrek) shows monthly US job gains and losses from 1986 through 2019 and highlights the last three recessions – in 1990, 2001, and 2008 – in grey bars.

The start of each of the last three recessions saw three months of consecutive job losses and in each case one month showed employment levels declining by 200,000 workers (the data is called out in red font).

Source: Datatrek and Federal Reserve Economic Data (FRED)

For the situation today, the economy has created an average of about 15,000 jobs each month over the past half year.

That is a big downshift from the same period a year earlier, when the U.S. was adding 78,000 jobs on average each month, but we are still adding jobs, and it’s enough to keep the unemployment rate steady.

Another window on the employment situation in the US is the weekly initial unemployment claims data produced by the Department of Labor.

The latest release, on April 2 showed that for the week ending March 28, seasonally adjusted initial unemployment claims came in at 202,000 — nearly matching the two-year low of 201,000 set in January. The four-week moving average for initial unemployment claims stands at 207,750.

Today’s labor market statistics are not consistent with an economy on the verge of recession.

Historically, initial claims begin to rise meaningfully — typically above 250,000 to 300,000 on a sustained basis — well before a recession is formally declared.

At current levels, the data show that employers are simply not laying off workers at a pace that signals economic distress.

This is the crucial dynamic: recessions are generally caused not by rising prices alone, but by rising prices combined with rising unemployment. When workers lose their jobs, they cut spending, businesses respond by cutting more jobs, and the cycle feeds on itself.

That negative feedback loop requires a deteriorating labor market to get started — and right now, the labor market is not deteriorating. Employers appear to be choosing to hold on to their workforce even as energy costs rise, absorbing some margin pressure rather than triggering layoffs.

Until weekly unemployment claims begin trending meaningfully higher, the unemployment rate climbs toward 5%, or monthly payroll additions turn consistently negative, the labor market will remain an important shock absorber for the US economy.

What We Are Watching

None of this means the risks are trivial. We are monitoring three variables closely:

  • The duration of Strait of Hormuz disruptions. A prolonged closure — measured in months rather than weeks — would change the calculus significantly. If oil prices average $140 or above into the summer, recession risk rises sharply.
  • Consumer spending. Energy costs are effectively a tax on households, and if they cause consumers to meaningfully pull back on discretionary spending, the resulting slowdown in business activity and hiring could become self-reinforcing.
  • Inflation persistence. If the oil shock pushes headline inflation durably above 4%, the Fed’s room to maneuver shrinks and the stagflation scenario becomes more credible.

The Bottom Line

The Iran war has made 2026 a more difficult year for the U.S. economy. Growth will be slower than it might otherwise have been, inflation will be stickier, and uncertainty is elevated.

But the U.S. enters this challenge with significant structural advantages: energy self-sufficiency, fiscal momentum, an AI-driven investment boom that seems to be durable, and a Federal Reserve that retains meaningful flexibility.

History tells us that oil shocks cause recessions when they are severe, sustained, and met with policy that amplifies rather than cushions the blow. None of those three conditions are clearly in place today.

As I was writing this article, the tagline for the ad campaign for Energizer batteries came to mind: “still going”.

Despite a foreign conflict with wide-ranging implications, including grave concerns by many US consumers and a current sky-high oil price, the US economy is still going.

While the risks to an economic downturn are significantly higher now than they were before February 28, my sense is that the U.S. economy will navigate this shock without entering recession in 2026.

March 2026 Market Recap: Resiliency, Tested

The war in Iran that began in late February continued throughout March. This put downward pressure on stock and bond prices, as investors worried about how long hostilities would last.

The main concern in March was the inflationary impact of significantly higher oil prices.

The price of oil rose between 50 – 65% in March (depending upon which benchmark oil price is referenced). Many Americans are now paying $4 per gallon of gas.

If the war shows no signs of letting up soon, investors’ concerns will shift to the broader impact on the economy, the likelihood of slower growth, the impending hit to company profits, and the possibility of recession.

We are not at an economic crossroads yet.

The US economy has proven resilient in the face of stress in the energy markets in the recent past.

For example, there was no recession in 2022 when oil prices spiked after war broke out in Ukraine. It’s reasonable to expect that this also will be the case in 2026.

Currently, most forecasters still expect the US economy to expand in 2026 (see the following article) and for company profits to rise.

But if hostilities extend well into the spring, US economic resiliency may be tested further, which would likely mean continued challenges for the financial markets.

The month of March closed with a positive tone with stocks rising 3% on the last day of the month as the US administration signaled its willingness to end the military campaign in Iran.

Investors need to keep in mind that the political and military situation is fluid and volatile; that stocks could decline significantly from today’s levels; and that developments in the Middle East will have a strong impact on the financial markets in the months ahead.

Here are results for March and 2026 Year-to-Date, compared to longer-term annualized returns (10-Year Trailing):

Note: YTD 2026 as of 3/31/2026; Source: Morningstar

More On Iran – How We Got Here: Recommended Resources

You may be interested in where to turn for thoughtful, reliable coverage of the situation in Iran and the broader Middle East — sources that go beyond the daily news cycle and offer real context.

Below are two books and two podcasts (in addition to The Dispatch Podcast highlighted in the previous article) that you may find valuable.

The books provide essential historical background on how we arrived at this moment; the podcasts offer informed, ongoing analysis as events continue to unfold.

For Further Reading

Black Wave: Saudi Arabia, Iran, and the Forty-Year Rivalry That Unraveled Culture, Religion, and Collective Memory in the Middle East – Kim Ghattas (2020)

Kim Ghattas is a Lebanese-born journalist who grew up in Beirut during the civil war, served as a BBC Middle East correspondent and later as the BBC’s State Department correspondent, and is currently a senior fellow at the Carnegie Endowment for International Peace.

In Black Wave, named a New York Times Notable Book, she argues that the modern Middle East’s descent into sectarianism, extremism, and cultural repression traces back to the convergence of three events in 1979: the Iranian Revolution, the siege of the Grand Mosque in Mecca, and the Soviet invasion of Afghanistan.

From that point, she traces how Saudi Arabia and Iran — once allies — became rivals in a contest for religious and political supremacy that went far beyond geopolitics, distorting societies across the region for decades.

What sets the book apart is Ghattas’s narrative approach: rather than offering a dry policy history, she tells the story through the lives of individuals across seven countries and four decades — writers, journalists, and ordinary citizens whose lives were upended by forces largely beyond their control.

King of Kings: The Iranian Revolution — A Story of Hubris, Delusion, and Catastrophic Miscalculation – Scott Anderson (2025)

Scott Anderson is a veteran war correspondent who has reported from conflict zones across the globe — including Lebanon, Israel, Egypt, Chechnya, and Bosnia — and a contributing writer for the New York Times Magazine.

His earlier book Lawrence in Arabia is widely regarded as one of the essential texts on the origins of the modern Middle East. King of Kings, which won the 2025 Kirkus Prize for nonfiction and was a New York Times bestseller, is a narrative history of the 1978–79 Iranian Revolution.

Anderson centers the story on the Shah of Iran, who presided over vast oil wealth and American backing yet proved fatally disconnected from his own people, and on Washington, where a massive intelligence and military presence in-country failed to see the revolution coming.

Drawing on recently discovered sources and interviews with direct participants, including the Shah’s widow, Anderson makes a compelling case that the revolution was not inevitable but was the product of cascading miscalculations. — a theme that may resonate as US policy toward Iran is once again being tested.

For Further Listening

The FRONTLINE Dispatch (PBS)

FRONTLINE has long been one of the most trusted names in investigative journalism, and its podcast arm has responded to the current crisis with characteristically thorough coverage.

A recent episode examines the roots and ramifications of the U.S.-Israeli military operation in Iran, drawing on FRONTLINE’s deep bench of reporting on the region. PBS is also airing updated versions of two companion documentaries — Remaking the Middle East: Israel vs. Iran and Strike on Iran — later this month. For those who want rigorous, nonpartisan analysis of how we arrived at this moment and what may come next, this is a good place to start.

Iran: The Latest (The Telegraph)

For those who want to follow the conflict on a daily basis, this podcast from The Telegraph is a worthy source. Hosted by veteran foreign correspondents Roland Oliphant and Venetia Rainey, it offers daily updates and in-depth interviews with military strategists, international relations scholars, and Middle East policy experts.

Because it is produced by a British outlet, the coverage tends to be less filtered through American partisan dynamics and more focused on the broader geopolitical picture — including the war’s impact on Gulf states, European energy markets, and the wider diplomatic landscape. It is particularly useful for listeners who want to stay informed without being overwhelmed by the volume of U.S. cable news coverage.

War with Iran: What It Means for Investors – and What to Do

As we absorb the events unfolding since the United States and Israel launched joint military operations against Iran on February 28, I want to begin by acknowledging what I suspect many of you are feeling. For those of us who believe in diplomacy, value restraint, and care deeply about the human costs of armed conflict, the current trajectory of U.S. foreign policy is profoundly troubling — and I share those concerns.

However, a fuller discussion of the moral and humanitarian dimensions of this conflict falls outside the scope of this letter. My purpose here is a narrower one: to examine the military and political landscape as it stands now and to assess the risks this conflict may pose to the economy, the financial markets, and your financial plans.

This letter focuses on:

1.     An assessment of the current situation

2.     What to monitor going forward

3.     Recent financial market and economic developments

4.     Geopolitical uncertainty and stocks

5.     What this means for your financial plan

1: Current Situation Assessed – The Convoluted Case For War

One source that I found particularly helpful was the March 6 podcast of The Dispatch entitled “The Convoluted Case for War with Iran.” The Dispatch is a non-partisan but conservatively oriented show covering US politics, policy, and culture.

Host Steve Hayes was former editor-in-chief of The Weekly Standard. Co-host Jonah Goldberg is a conservative journalist and fellow at the American Enterprise Institute. Guests Mike Nelson and David French are both ex-US military officers.

All commentators offered context for and criticism of US actions in Iran. Below is a summary of the podcast.

Core Questions About the Conflict

The conversation is organized around two central questions: (1) Why is the United States engaging in military action against Iran at all? and (2) Why did the administration choose to act at this specific moment?

A secondary theme throughout the episode is whether the administration has adequately explained its strategy and end goals to Congress and the public.

Substantive Case for Action (“Why?”)

The panel broadly agrees that, on substance, a case for military action against Iran is not difficult to articulate. Iran is described as a long-standing adversary of the United States, engaged for decades in hostile activity through proxies, regional destabilization, and attacks that have resulted in American casualties.

Participants emphasize that Iran’s ideological hostility toward the U.S. and Israel, combined with nuclear ambitions, has long placed it in a distinct category among U.S. adversaries. On this point, there is general consensus among the panelists that Iran’s behavior over many years provides a plausible justification for the use of force.

Timing of the Conflict (“Why Now?”)

The more contested issue is timing. Participants argue that the current moment presents a strategic window: Iran’s regional proxy network has been weakened, its air defenses and military infrastructure have been degraded, and traditional deterrence mechanisms appear less effective than in prior years.

From this perspective, acting now may be less costly than acting later, when Iran could rebuild capabilities or enhance deterrence. However, while the panel finds this reasoning coherent, they repeatedly note that it has not been clearly or consistently articulated by the administration itself.

Messaging and Public Explanation

A major theme of the episode is criticism of the US Administration’s messaging. Participants express concern that multiple, shifting explanations have been offered for the war, sometimes inconsistently and retroactively.

This, they argue, undermines public confidence even where valid strategic reasons exist. The discussion highlights the risk that unclear or contradictory explanations make it harder for the public to understand the objectives of the campaign or assess its success.

Tactical Success vs. Strategic Outcome

The panel generally agrees that, from a tactical and operational standpoint, early military actions appear effective in degrading Iranian capabilities. However, they stress that tactical success does not automatically translate into strategic success.

A recurring concern is the absence of clearly defined end goals. Without explicit criteria for success — such as regime change, deterrence, or long-term containment — the administration retains broad flexibility to declare victory, but at the cost of strategic clarity.

Long-Term Risks and Historical Analogies

One participant raises concern that the campaign resembles a strategy of periodically weakening an adversary without fundamentally resolving the underlying conflict. Historical analogies are drawn to past situations where temporary degradation of hostile regimes delayed, rather than prevented, future retaliation.

The panel cautions that Iran’s willingness to absorb losses and respond asymmetrically could mean that consequences emerge months or years later, potentially through terrorism or proxy activity rather than direct confrontation.

Constitutional and Governance Considerations

Beyond military strategy, participants emphasize that bypassing Congress and failing to prepare the public is not merely procedural. They argue that democratic legitimacy and public understanding are essential for sustaining military action and managing long-term consequences.

The 4–5 Week Policy Outlook

The episode concludes with host Stephen Hayes noting that President Trump has suggested the operation could last four to five weeks and posing a forward-looking question: what outcomes would be encouraging, and what warning signs might indicate escalation or failure?

A more optimistic outlook would feature a short-duration operation, limited regional escalation, sustained degradation of Iranian capabilities, and a clear conclusion to hostilities.

A more concerning outlook would involve unclear objectives, prolonged engagement, retaliatory attacks beyond the immediate conflict, or a cycle of repeated military action without durable resolution.

Overall Takeaway

From a markets and policy-risk perspective, the episode suggests that uncertainty and clarity matter at least as much as military outcomes. Tactical success alone does not eliminate risk; how policymakers define objectives, communicate progress, and conclude operations will likely shape market responses more than any single military development.

2: What To Monitor Going Forward

This checklist identifies indicators we may monitor to help contextualize events as they unfold, as well as the related risks and uncertainties.

  • Duration and Scope of Military Operations – Why it matters: Duration clarity often affects markets and prices more than initial military action.
  • U.S. Policy Clarity and Governance Signals – Why it matters: Policy predictability and institutional process influence confidence and risk assessment.
  • Regional Escalation Indicators – Why it matters: Indirect escalation can affect markets even without direct U.S.–Iran confrontation
  • Energy Market Sensitivities – Why it matters: Energy prices can influence inflation expectations and broader macro assumptions.
  • Retaliatory or Asymmetric Risk Signals – Why it matters: These risks often emerge later and are harder for markets to price in advance.
  • Market Behavior vs. Headlines – Why it matters: Differentiating noise from signal helps assess whether risk is being repriced by financial assets or absorbed.
  • International Diplomatic Activity – Why it matters: Diplomatic engagement can materially alter risk trajectories without military change.
  • Domestic Political Spillovers – Why it matters: Domestic politics can influence policy durability and future decision-making.

3: Recent Financial Market and Economic Developments

The initial market reaction to Operation Epic Fury was surprisingly muted. On the first trading day after the February 28 strikes, the S&P 500 closed essentially flat. That composure didn’t last.

As the conflict expanded through the week — with Iranian retaliatory strikes hitting Gulf state infrastructure, the Strait of Hormuz effectively closing to commercial shipping, and oil storage facilities coming under attack — investor sentiment shifted considerably.

By week’s end, market participants were no longer treating this as a brief geopolitical tremor but were instead pricing in the possibility of sustained economic disruption. US large company stocks declined by 2% in the first week of March; foreign stocks slid by nearly 7%; and US investment grade bonds were down by about 1%.

Oil and Energy: The Central Transmission Mechanism

Oil prices have been the most direct channel through which the conflict is affecting markets. Brent crude had risen roughly 27% since the strikes began, and traded around $93 per barrel as of Friday, March 6. The oil price rise continued on Monday, with Brent crude moving above $100 per barrel.

The concern extends well beyond Iran’s own output of approximately 3 million barrels per day (roughly 4–5% of global supply). The Strait of Hormuz, through which passes about a fifth of the world’s oil and liquefied natural gas, has been effectively closed due to threats and the withdrawal of cargo insurers.

Approximately 20 million barrels per day flow through the region — representing about 20% of global demand — and there is simply no way to replace that volume from other sources if the disruption persists.

The scenario analysis matters here. According to JP Morgan’s energy research team, current oil prices reflect markets pricing in a Strait of Hormuz closure lasting 3–4 weeks, but not longer.

If the strait were to reopen tomorrow, oil would likely fall back to around $65 per barrel, since the market was well supplied before the war.

If hostilities extend beyond a month and the strait remains closed, the price of oil could stay well above $100 per barrel for some time. Each $10 increase in crude oil prices adds an estimated 0.2 to 0.4 percentage points to the inflation rate.

Goldman Sachs has warned that prices could reach $150 per barrel — all-time highs — if the conflict continues through the end of March.

The disruption extends beyond crude oil. Natural gas facilities in the Gulf, such as those in Qatar, have been taking gas out of their systems to limit damage from potential strikes. Even after hostilities end, it will take time for these facilities to ramp back up, creating inflationary pressure particularly for Asian markets that depend on Middle Eastern gas.

Refinery activity in some Gulf states has been reduced by 20–30%. Shipping rates have skyrocketed: the daily charter rate for a very large crude carrier, which normally runs around $50,000, reached $430,000 per day at the start of the week. These lag effects mean that even a swift resolution to the conflict would not immediately normalize energy markets.

For U.S. consumers, the most visible effect is at the gas pump. The average price of gasoline rose to approximately $3.25 per gallon as of March 6, up $0.27 in a single week. (The average price of gasoline moved even higher on Monday, March 9 – toward $3.50 per gallon).

If gasoline prices climb to $3.50 or $4.00 per gallon and stay there, it will squeeze lower- and moderate-income consumers and weigh on consumer spending — not enough to push the economy into recession on its own, but enough to be felt.

A Structural Difference: The U.S. as Energy Exporter

One important distinction from prior oil shocks — and a reason for cautious optimism — is that the United States is now a net energy exporter and the world’s largest oil producer.

In previous conflicts (1979, 1990, 2008), every additional dollar spent on oil was flowing overseas to foreign producers. Today, much of that spending stays in the domestic economy, benefiting U.S. producers.

This is a meaningful structural change that limits the drag on U.S. growth relative to prior energy shocks, though it does not eliminate the inflationary impact.

Winners and Losers: Rotation Accelerates

The war has reinforced and accelerated a rotation in market leadership that was already underway.

Value and dividend-oriented stocks have continued to outperform growth stocks, a pattern consistent with historical precedent: Morgan Stanley research has found that value and dividend yield tend to outperform in the month following geopolitical shocks that push oil prices higher. Energy companies and defense contractors, which populate both categories, have benefited directly.

Internationally, the damage has been more severe. Energy-importing economies — Europe, Japan, and South Korea — have been hit hard.

South Korea’s market fell 16% in the past week, and international stocks broadly have declined roughly 6–7% from their pre-war highs, a pattern similar to the early days of Russia’s 2022 invasion of Ukraine. The dollar has strengthened as the U.S., with its energy exporter status, is relatively better positioned than major importers.

Within the U.S. market, a notable pattern has emerged: the stocks that had risen the most before the war started have fallen the most since, while previous laggards have held up better or even gained ground. This reflects both a reassessment of economic winners and losers and a reduction in borrowing by institutional investors.

The Economic Outlook

Before the strikes, the global economy was accelerating and expanding faster than in 2025. The U.S. economy entered this period on relatively solid footing: consumer and business spending had been robust, asset prices had boosted household wealth, and there were early signs that the long manufacturing slump might be easing.

JP Morgan’s base case for U.S. GDP growth is approximately 2% for 2026, though the quarterly path is uneven: a softer first quarter (around 1% annualized, reflecting weather effects and delayed tax refunds) followed by a pickup to 2–3% growth in the second and third quarters, then moderating again in the fourth quarter. This base case assumes a relatively short conflict.

On inflation, the picture is more nuanced. JP Morgan expects inflation to rise above 3% by June, driven primarily by energy prices, then to decline as oil prices moderate — potentially returning to 2% by year-end and below 2% by 2027. But this path depends heavily on the duration and scope of the conflict. A prolonged disruption to energy markets would make this trajectory considerably less favorable.

The Fed’s Dilemma

The conflict complicates the Federal Reserve’s path forward. Before the war, markets expected multiple short-term interest rate reductions (cuts) in 2026. Now, betting markets show the odds of multiple cuts falling, with one cut or no cuts becoming more likely.

The concern is straightforward: rising oil prices feed into inflation, and the Fed may feel it cannot cut rates into an inflationary environment — even if the economy softens. This creates a potential stagflationary dynamic that, while not the base case, is now being actively discussed by economic forecasters.

The Fiscal Backdrop

This conflict arrives against a fiscal backdrop that offers less cushion than in prior military engagements. U.S. national debt stands at approximately $33 trillion — more than $250,000 per household.

The Congressional Budget Office projected a $1.9 trillion deficit for 2026 before accounting for war costs, which are currently estimated at $50–100 billion but subject to revision.

How the war will be funded remains an open question. All of this adds to overall government borrowing and creates a headwind for fixed income markets – which reduces the likelihood that Treasury bond yields will decline.

What This Means for Investors Today

As JP Morgan’s chief global strategist David Kelly put it on a recent client call: the message in this environment is to diversify against unknown risks. The underlying U.S. economy is not in danger of recession from this conflict alone, and markets so far have reflected more caution than panic.

But the range of possible outcomes is wide, and tail risks — whether from a prolonged conflict, an escalation beyond the current theater, or unexpected second-order effects — are elevated.

As discussed in the next section, geopolitical shocks have historically been poor reasons to abandon a long-term investment strategy. The S&P 500 has a median return of 9.7% in the year following major geopolitical disruptions, according to research by the Hartford Funds (see table below).

But the key variables are duration and scope: a contained, short-duration conflict is far more manageable for markets than a prolonged engagement with escalating regional consequences. This is precisely why the signposts outlined in Section 2 matter so much — and why we will continue to monitor them closely on your behalf.

4: What Geopolitical Uncertainty Means for the Stock Market

Geopolitical uncertainty can cause short-term market volatility, but when faced with disruptive episodes in the past, the stock market has been resilient.

In fact, as the table below shows, stocks generated positive performance one year after a geopolitical / military event 73% of the time, considering twenty-two instances since World War II.

Source: Hartford Funds

And the longer the investment time frame, the more likely the positive return. Five years after a major geopolitical / military event, in all but one instance, the stock market was higher.

The one case where stocks were still struggling five years after the start of an event was the Arab Oil Embargo of October 1973. The reason why stocks had such a hard time in the mid-1970s had to do with both cyclical issues (long recession) and structural issues, including: price controls; the influence of unions in the labor market; and dependence on foreign oil.

Today, the structural foundation of the US economy is different. Unlike in the 1970s, the US is now the world’s largest producer of oil and natural gas. And the US economy is far more energy efficient today, so a spike in oil prices can’t “break” the US economy as easily as it once did.

Also, the Federal Reserve has a long history of anchoring inflation expectations, which would help prevent a 1970s style inflationary wage-price spiral.

While we can’t completely rule out a scenario for the stock market that parallels the mid-1970’s, I would assign this type of outcome a low likelihood.

5: What This Means for Your Financial Plan

While the current conflict introduces real uncertainty into markets, we do not believe it is likely to fundamentally alter the financial plans of most U.S.-based investors. Here is why — and what, if anything, you should be thinking about.

Your plan was built for environments like this

A well-constructed financial plan accounts for the reality that markets will periodically experience shocks — whether from geopolitical events, recessions, policy surprises, or other disruptions.

If your portfolio is appropriately diversified and aligned with your time horizon and risk tolerance, it is already designed to absorb periods of elevated volatility. The historical data above reinforces this: markets have recovered from the vast majority of armed conflicts, and the longer the time frame, the more reliable that pattern has been.

The U.S. economy has structural buffers

As discussed in Section 3, the United States is now a net energy exporter — a meaningful change from prior oil shocks that sent dollars overseas and deepened domestic downturns.

The economy entered this period with solid consumer balance sheets, strong employment, and rising asset values.

While higher energy prices will create headwinds for some households and sectors, the base case among major forecasters remains positive GDP growth for 2026. This is not the kind of backdrop that typically derails long-term financial plans.

Short-term volatility is not the same as long-term risk

It is natural to feel uneasy when markets are volatile and the news is alarming. But the decisions that matter most for your financial future — your savings rate, your asset allocation, your tax planning, your withdrawal strategy — are driven by factors that operate over years and decades, not days and weeks.

Reacting to short-term market moves by selling equities or shifting to cash has historically been far more damaging to long-term outcomes than the events that prompted the reaction.

That said, this is a reasonable moment to review — not overhaul — your plan. There are a few areas where a check-in may be worthwhile:

  • Cash reserves and liquidity. If you are retired or approaching retirement, confirm that you have adequate cash and short-term reserves to cover near-term spending needs without being forced to sell into a down market. A general guideline is about 12-24 months of spending in liquid, low-volatility holdings (which can include savings in bank accounts in addition to cash and short-term bond fund holdings in investment accounts).
  • Rebalancing opportunities. Market dislocations can push portfolios away from target allocations. If equities have declined meaningfully relative to bonds or other holdings, rebalancing back toward your target — essentially buying into weakness — is a disciplined way to take advantage of volatility.
  • Tax-loss harvesting. For taxable accounts, market declines can create opportunities to realize losses that offset gains elsewhere in the portfolio, improving after-tax returns without changing your overall investment posture.
  • Emotional preparedness. This may be the most important item on the list. If the current environment is causing you significant stress about your portfolio, that itself is useful information. It may indicate that your allocation carries more risk than you are truly comfortable with — and a calm, deliberate adjustment now is far better than a panicked one during a deeper downturn.

Our Commitment

We are monitoring this situation closely and will continue to share our assessment as events develop. If you have questions about how the conflict may affect your specific circumstances, or if you would like to review any aspect of your financial plan, please do not hesitate to reach out. That is exactly what we are here for.

February 2026 Market Recap: Foreign Markets Lead the Pack in February

The big market story for the year through February has been foreign stock market leadership. Foreign stocks almost matched their excellent January performance (4.9%) in February (4.6%). Currency was not a significant driver of dollar-based returns in either period.

In February, US large company stocks slipped, declining by 0.9%, compared to January’s positive return of 1.5%.

Within US equities, the rotation out of large company US technology stocks has shifted from January’s move into small company stocks to February’s preference for non-technology large company US stocks.

The bond markets continued to show positive results. Intermediate- and long-term Treasury bond yields declined over the course of February. The 10-Year Treasury bond yield actually fell below 4% for the first time in several months. The benchmark for US Investment Grade Bonds returned 1.6% in February.

Here are results for February and 2026 Year-to-Date, compared to longer-term annualized returns (10-Year Trailing):

Note: YTD 2026 as of 2/28/2026; Source: Morningstar

Checklist for My Family

Sally Balch Hurme, is an elder law attorney and longtime expert on aging, family caregiving, and end‑of‑life planning. She has spent decades working with families on issues such as long‑term care, estate planning, and decision‑making during medical crises, and she has also served in advisory and educational roles related to aging and public policy.

In Checklist for My Family: A Guide to My History, Financial Plans, and Final Wishes, Hurme delivers a practical, compassionate resource designed to help individuals organize the information their loved ones will need in the event of illness, incapacity, or death.

The book’s strength lies in its checklist format, which walks readers through topics that are often postponed because they feel overwhelming or uncomfortable. Hurme covers far more than just finances.

The guide prompts readers to record personal history, key contacts, legal documents, financial accounts, insurance policies, digital assets, medical preferences, and final wishes.

By breaking these subjects into clear, manageable sections, the book reduces the likelihood that important details are forgotten or left scattered across files, emails, and conversations.

This book is especially useful because it is about preparing families to act with clarity and confidence when it matters most. For spouses, adult children, and other caregivers, having this information in one place can significantly reduce stress, conflict, and uncertainty during already emotional times.

For the person completing the checklist, the process itself often leads to better conversations and more intentional planning. In short, Checklist for My Family is a valuable complement to professional financial and estate planning—helping ensure that a well‑designed plan can actually be carried out smoothly by the people you care about most.

When Should You Claim Social Security?

Executive Summary

Social Security is one of the few sources of guaranteed, inflation-adjusted income available in retirement, so the decision of when to claim is critical for building a resilient income plan—especially for couples planning for a potentially long retirement. In many households, the benefit that matters most is the one that may later become the survivor benefit, which is why coordinated strategies often differ between partners.

This article explains the key trade-offs (income now vs. higher income later), how portfolio and market risks can affect the ‘bridge’ years, and common myths to avoid, with brief case studies showing why strategies can differ for earnings-gap couples versus near-equal earners.

The article draws from a paper by Brian Allevia, a research analyst at the Social Security Administration, recently published in the Journal of Financial Planning, as well as articles from practitioners Edward McQuarrie, William Bernstein, Derek Tharp, and Michael Kitces.

A Deceptively Simple Question

One of the most common questions we hear from clients approaching retirement is deceptively simple: “When should we start Social Security?”

If you’ve ever tried to answer that question by searching online, you already know the problem: the internet offers confident advice in every direction. “Always claim at 62.” “Always wait until 70.” “Just calculate your break-even age.”

The truth is more nuanced—especially for couples.

Social Security is a unique component of the retirement plan. For most households, it’s the only source of income that is (1) guaranteed for life and (2) inflation-adjusted. That combination makes it a foundational building block for a retirement that could last 25, 30, or even 35+ years.

A more appropriate question to start with may be “how long might retirement last?”

When people debate Social Security claiming, they often frame it as an investment decision: “Will I get my money back if I delay?” But the bigger issue for many retirees is longevity risk—the risk that you live longer than expected and need steady income far into the future.

Delaying Social Security can be valuable because it increases the amount of inflation-adjusted income you cannot outlive, strengthening the “income floor” that supports your lifestyle even if markets disappoint or inflation runs higher than planned.

And this matters even more for couples: while any one person may or may not live into their 90s, the odds that at least one spouse/partner does so are meaningfully higher. That’s one reason delaying can look especially attractive for couples—because the higher benefit may be paid for as long as either spouse is alive (through survivor benefits).

Income Now vs. Higher Check Later (For Life)

You can generally claim Social Security as early as 62 or as late as 70. Claiming early means you receive more checks sooner, but at a permanently reduced monthly amount. Waiting means fewer checks at first, but a higher monthly benefit for life.

Example (illustrative): A retiree might receive roughly $2,100/month at age 62, $3,000/month at full retirement age (around 67), or $3,720/month at age 70.

A quick note on “break-even”: People often ask for the “break-even age”—the point when total dollars received by delaying exceed total dollars received by claiming early. Break-even analysis can be a helpful reference, but it’s incomplete.

The breakeven period depends on inflation and the returns you assume you could earn if you claimed earlier and invested the payments (or avoided withdrawals).

More importantly, break-even analysis often misses the real retirement planning goal: building an income plan that can support you if you live a long life—and for couples, supporting the surviving spouse as well.

Why Couples are Different: Not Two Separate Decisions

For married couples, Social Security is rarely just “two independent choices.” It’s a household decision.

Survivor benefits change everything: When one spouse dies, the surviving spouse generally keeps the higher of the two benefits. That means the higher earner’s claiming decision often determines the survivor’s long-term income.

This is why many studies and planning frameworks often find that for “traditional” couples—where one spouse clearly earned more—the strategy that often makes sense is: higher earner delays (frequently toward age 70) and lower earner claims earlier.

Complexity warning: Couples can face thousands of claiming combinations once you account for worker benefits, spousal benefits, and survivor benefits.

As more couples reach retirement with similar earnings histories, the “standard” strategy can shift—sometimes dramatically—based on age differences and earnings ratios.

Why One-Size-Fits-All Advice Doesn’t Work – Two Case Studies

Case Study #1: A classic earnings-gap couple (where the familiar approach often fits)

John is 66 and Meghan is 64. John has the stronger earnings record and expects about $3,200/month at full retirement age, while Meghan expects about $1,600/month (illustrative).

They asked: “Should we both wait until 70 so we get the biggest checks?”

For John and Meghan, the survivor benefit is the center of the analysis. If John delays, his benefit increases—and if he dies first, Meghan can step up to that higher amount as her survivor benefit. The result is often a meaningful increase in the survivor’s lifetime inflation-adjusted income.

A coordinated strategy that frequently fits this earnings-gap structure is: John (higher earner) delays (often toward or at age 70) and Meghan (lower earner) claims earlier (sometimes at 62 or around full retirement age depending on cash flow and goals).

Case Study #2: Near-equal earners (where the strategy flips relative to earnings)

Jane is 66 and Lucy is 68. They both worked full careers and have very similar benefits, with Jane’s record slightly higher: Jane ≈ $3,050/month at full retirement age and Lucy ≈ $2,950/month.

They assumed: “Jane is the higher earner, so Jane should delay to 70.”

In near-equal earner couples, the survivor-benefit advantage of delaying the “higher” record can be smaller because the two benefits are already close.

In these cases, research suggests timing and age order can matter more—specifically, the advantage of having the spouse who can reach age 70 first be the one who delays, so the household begins a maximized benefit sooner while maintaining survivor protection.

So for Jane and Lucy, a coordinated approach can look like this: Lucy (older, slightly lower earner) delays to 70, while Jane (younger, slightly higher earner) claims earlier (for example, around full retirement age).

That’s the flip relative to earnings: the lower earner delays and the higher earner claims earlier. As more couples retire with similar earnings histories, this nuance becomes increasingly important—and it’s why we avoid blanket rules-of-thumb.

The Portfolio Question: Can You Fund the Bridge Years Safely?

Claiming decisions don’t happen in isolation. They interact with your investment portfolio.

If you delay Social Security, you typically rely more on savings early in retirement, then rely less later because Social Security covers more of your ongoing expenses. That can be a great trade—if the bridge is affordable and well-managed.

Reasons delaying can be attractive: Delaying can increase the inflation-adjusted income floor, reducing the risk of running short later in life—especially if markets disappoint or inflation rises more than expected.

Reasons delaying may be less attractive for some households: Delaying can increase sequence-of-returns risk if markets decline early and you’re forced to take larger withdrawals while waiting.

Bottom line: The decision often comes down to how much guaranteed, inflation-adjusted income you need to feel secure—and whether the bridge years can be funded without undue risk.

Behavioral Realities: the Best Strategy Is Also the One You’ll Follow

There’s also a human element here.

Some retirees are more comfortable spending from a “paycheck” than drawing down investments. In practice, delaying Social Security can sometimes lead to underspending and reduced enjoyment, particularly early in retirement.

At the same time, delaying the right benefit—especially for couples where survivor benefits matter—can be an effective way to protect the household later in life, when flexibility is lower and the consequences of reduced income can be more severe.

Our goal is to find the strategy that balances both: enjoying the early years of retirement and protecting long-term income security.

A Practical Framework for Evaluating Claiming Decisions

When we help clients decide, we typically walk through four questions:

  1. Which benefit is most important for survivor planning? If one benefit is clearly higher, its claiming age often has outsized impact because it can become the survivor benefit.
  2. What does longevity look like for your household? We consider family history, health, and the realistic possibility that one spouse lives well into their 90s.
  3. How will we fund the bridge years, and what is the market risk? We assess the portfolio withdrawal plan and the potential impact of early market declines (sequence risk).
  4. What strategy will you feel comfortable sticking with? A plan that creates anxiety is less likely to be followed—so preferences and spending comfort matter.

Common Social Security Myths (and What Really Matters)

Over the years, we’ve noticed that many Social Security decisions are driven by rules of thumb that sound reasonable—but don’t always hold up when applied to real households. These myths persist because Social Security rules are complex, and it’s tempting to reduce an important lifetime decision to a simple slogan.

Myth #1: “I should claim as soon as I break even.” Reality: Break-even analysis focuses on total dollars received, but it often ignores longevity, inflation, market volatility, and survivor income needs.

Myth #2: “If I die early, delaying was a mistake.” Reality: This treats Social Security like an investment rather than what it often represents in a plan: longevity insurance.

Myth #3: “For couples, both spouses should always delay.” Reality: In reality, it often does not pay for both spouses to delay.

Myth #4: “The higher earner should always be the one who delays.” Reality: Often true in earnings-gap couples—but not always. In near-equal earner couples, the strategy can flip relative to earnings.

Myth #5: “Delaying is always better than investing the money.” Reality: Portfolios carry risk and inflation is unpredictable. Whether delaying makes sense depends on portfolio size, withdrawal needs, and sequence risk.

Myth #6: “There’s a single right claiming age for everyone.” Reality: Claiming decisions vary by health, longevity, earnings history, household dynamics, portfolio structure, and preferences.

Bringing It All Together

Taken together, these myths point to a simple conclusion: Social Security claiming is not about finding a perfect age—it’s about building a resilient retirement income plan.

For some households, that means delaying at least one benefit to protect against a long life and rising costs. For others, it means coordinating benefits to support early-retirement cash flow without sacrificing long-term security.

At Moore Financial Advisors, our goal is not to push clients toward early or late claiming by default. Our goal is to help you understand the trade-offs, coordinate benefits thoughtfully, and choose a strategy that still works if retirement lasts longer than expected or markets don’t cooperate.

Social Security is one of the few financial decisions that can permanently raise—or lower—the income you can never outlive. When coordinated carefully, it can play a powerful role in supporting both your lifestyle today and your security far into the future.

If you’re approaching this decision, we encourage you to reach out. A well-designed Social Security strategy is one of the most valuable planning opportunities available—and one that deserves careful attention.

Market Update January 2026: AI Anxiety

For the past three years, developments related to Artificial Intelligence (AI) have captivated investors. Stocks of large technology companies associated with AI have done very well, and the biggest of the bunch have generally performed best.

Recently, however, stock market sentiment has shifted from AI excitement to AI anxiety.

The source of this anxiety is twofold, stemming from:

  1. Costs of Building AI: Developing AI infrastructure is costly; it will crimp the near-term profits of the companies building it; and it raises questions about profit margins for the AI infrastructure builders over the long term
  2. Results from Deploying AI: Expanded AI usage may be disruptive for jobs, companies, and the stock market

The Costs of Building AI

The term “hyperscalers” is being used to refer to the tech company giants that are building and operating massive cloud-based computing infrastructure that supports the training and deployment of Artificial Intelligence models.

In the United States, the hyperscalers are Alphabet (Google), Amazon, Meta Platforms (Facebook), Microsoft, and Oracle. Collectively, these five companies account for 17% of the S&P 500 index of large company US stocks.

In 2023, the year after ChatGPT emerged on the scene, hyperscalers’ capital expenditures (money spent for acquiring long-lived assets) was about $150 billion. In 2026, it’s expected to be about $650 billion.

For comparison, US federal government defense spending in 2026 is expected to come in at about $900 billion. And, $600 billion is about the size of the economies of Singapore and Sweden (measured by Gross Domestic Product, or GDP).

The sums being spent on AI infrastructure are enormous, and the acceleration of the spending is breathtaking. So, investors are questioning whether the capital commitments will be worth it.

Profitability has been high for the hyperscalers in recent years, but large-scale AI investment is expected to pull down profit margins in the near term. Investors understandably do not like seeing margins decline, even for companies with long-term track records of operational success.

Perhaps AI investment will pay off and returns will start trending higher next year and beyond. Or, perhaps the anticipated demand for the compute capacity will be less than expected, and profit margins will be lower for longer.

Here’s how hyperscaler stock prices have performed over the past three years, and so far in 2026, compared to the broad market for US large company stocks as represented by the S&P 500:

Note: YTD 2026 as of 2/20/2026; Source: Morningstar

The hyperscaler stock price stall is telling us that investors are less sure that today’s spending will translate to outsized profits in the future.

The Results from Deploying AI

It really is far too early to know what the effects of AI availability and AI usage will be.

But predictions affected stock prices in various areas of the market in the first part of February. Here are some examples:

  • AI developer Anthropic announced it was adding new legal tools to its Cowork assistant to help automate some legal drafting and research tasks. On February 3, shares of companies that provide legal tools and research databases dropped, as did other “software as a service” companies: Examples: Legalzoom dropped 20%; Thomson Reuters declined by 16%; Salesforce fell 7%.
  • OpenAI (maker of ChatGPT) said it was adding an app for homeowner insurance quotes. Shares of insurance brokers proceeded to decline. Example: Marsh & McLennan dropped 8% on February 9.
  • Financial custodian Altruist said its AI assistant could handle some tax-related tasks. Shares of brokers and financial custodians dropped. Example: Charles Schwab lost 7% on February 10.
  • A Florida-based firm said it could use AI to improve efficiency in the trucking business. Shares of airlines, railroads, and trucking firms slid. Example: C.H. Robinson shares lost 15% on February 12.
  • The CEO of Anthropic recently claimed that AI would wipe out half of all entry level white-collar jobs in the next one to five years, and Microsoft’s head of AI said that “most if not all” professional tasks would be automated within 18 months.

Some investors are inclined to shoot first before asking questions and seeing the results of AI deployment and utilization.

Other investors who hear about new technologies and see wild price swings in some stocks of established companies may be unsettled.

In his recent Weekly Commentary from February 17, professor and long-time market practitioner Jeremy Siegel offered these observations:

  • Technological change will continue to disrupt industries, and some business models will be impaired
  • Productivity growth is ultimately deflationary and wealth-enhancing
  • We may even see the long-discussed four-day workweek become viable over time as output per hour accelerates; that is not a recessionary signal, that is a prosperity signal
  • Anxiety is part of every technological transition
  • Today’s data tell us the economy is stabilizing, inflation is receding, and real incomes are rising
  • This is not a backdrop for derailing a bull market; it is a backdrop for its expansion

While it is worth having some perspective on what’s going on underneath the surface of a stock market, trying to pick winners and avoid losers as new technologies emerge is unadvisable.

A better, time-tested approach to investing is to maintain a diversified portfolio with exposure across sectors and markets, and to enjoy a rising tide that lifts many boats over the long term.

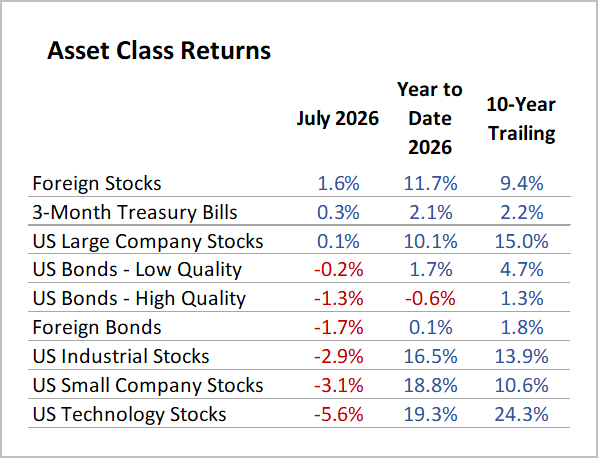
The financial markets got off to a satisfactory start for the first month of 2026. Here are results for January:

Source: Morningstar

Media for the New Year

The new year can act as a catalyst to expand horizons and vary daily routines. So far in 2026, I’ve expanded my regular news diet to incorporate balanced and diverse points of view from foreign-domicile media sources.

Here are three podcasts that I’ve been tuning into regularly, which you might find helpful:

  • BBC News – Newshour: the British Broadcasting Corporation (BBC) is the UK’s national public service broadcaster, founded in 1922 and operating as a chartered corporation, independent from government influence. This podcast is “long-form”, with daily episodes running about 45 minutes.
  • Reuters World News: the Reuters news agency was established in London in 1851 and acquired by the Thomson Corporation of Canada in 2008. This podcast is “short-form”, with daily episodes running about 10 minutes.
  • FT News Briefing: The Financial Times (FT) was founded in London in 1888. The British company Pearson, which had owned the FT since 1957, sold it to the Japanese holding company Nikkei a decade ago. This podcast has a financial markets orientation and is “short-form”, with daily episodes running about 10 minutes.

These daily productions can be accessed using a web browser, but you may find following via a podcast app more convenient. My favorite podcast app is Pocket Casts, which can be downloaded to your phone using the Apple App Store or through Google Play.

-RK