Category

Market Updates

May 2026 Market Recap: The Everything Rally

ASteve Sosnick, the chief market strategist at Interactive Brokers, referred to financial market activity in May as “the Everything Rally.” That’s not a bad way to frame what happened last month.

At the start of the month, investors were confronted with an unsigned Iran peace deal, oil above $100, inflation at a three-year high, a brand-new Federal Reserve chair, and a 30-year Treasury yield touching its highest level since 2007.

May closed with Technology sector posting another double-digit monthly gain. The S&P 500 index of large company US stocks rose 5.3% and closed at record highs on 11 days during the month. Foreign stocks gained more than 2.4%, and bond indices (despite large intra-month swings in yields) registered modest positive returns.

May was defined by three themes: the Iran war and its economic consequences; AI delivering broad-based, positive revenue trends in the technology sector; and a bond market that tested investor nerves.

The Iran War — Deal Always “Just Around the Corner”

The U.S.-Iran conflict is now in its fourth month. The Strait of Hormuz remained largely closed to commercial traffic, with only a handful of ships transiting daily versus 120 before the war.

Oil prices swung dramatically on diplomatic signals: Brent crude peaked near $126 in late April, fell toward $87 by month-end, then traded at various points in between as headlines shifted from hope to frustration and back again.

The month’s diplomatic arc was a recurring pattern: a constructive signal would arrive, sending oil sharply lower and stocks higher — only to be followed by a complication. By month-end, the memorandum of understanding between the US and Iran remained unsigned, and June opened with the same central question May had posed: when will a deal be signed?

The economic consequences of the conflict were visible throughout the month. Inflation hit 3.8% year-over-year — its highest since 2023 — driven heavily by energy. National average gas prices remained above $4.50 per gallon for most of the month.

And Goldman Sachs and Barclays both cautioned that even if the Strait fully reopened tomorrow, global oil inventories are so depleted that prices likely would normalize only gradually, not immediately.

Artificial Intelligence Delivers Positive Revenue Trends

April validated that AI is driving positive financial results for chip makers. May confirmed that AI demand is broadening into other areas of the technology ecosystem.

Some examples of how AI-driven demand is benefiting tech companies:

  • Dell Technologies, which many folks associate with personal computers, reported AI server revenue up 757% year-over-year, a record $51.3 billion AI order backlog, and raised its full-year revenue forecast by roughly $27 billion.
  • Cisco, another “old-line” technology-focused company, known for its networking gear that supports internet activity, raised its full-year AI order guidance to $9 billion — nearly double what it had guided just one quarter earlier.
  • Nvidia, the new tech standard bearer that designs chips, and also hardware networks to power data centers as well as specialized software, reported $81.6 billion in quarterly revenue — up 85% year-over-year — and guided its next quarter to $91 billion.
  • Cerebras Systems, which delivers supercomputer systems and cloud-based services, listed its shares through the largest tech initial public offering (IPO) since Uber went public in 2019, saw its shares surge 68% on the first day of trading.

The broader AI narrative for the month was captured well by one market analyst: “We started with chips and memory, but it’s really now about the broad AI infrastructure stack.”

And more AI-related activity is in store for investors in the months ahead, with SpaceX, Anthropic (maker of Claude) and OpenAI (maker of ChatGPT) all expecting to list their shares through IPOs and being trading on stock market exchanges later this year.

The Bond Market’s Warning

Not everything pointed straight up in May.

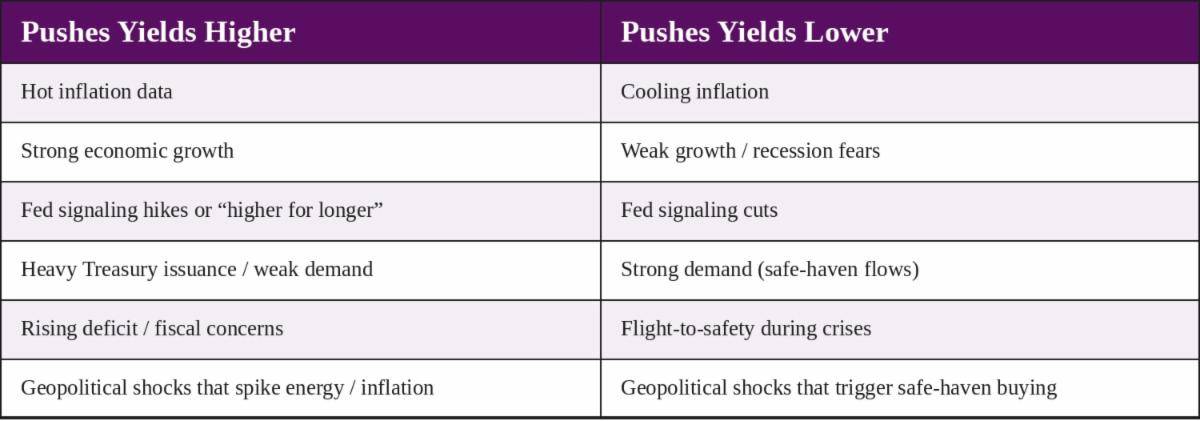
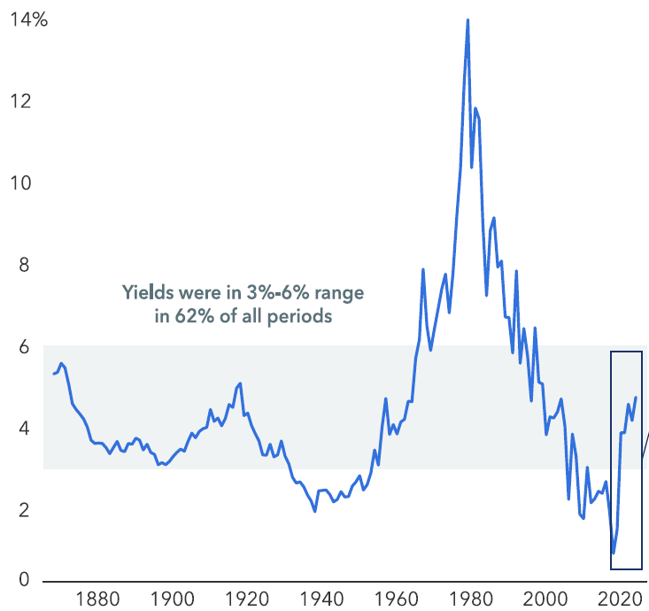
The bond market delivered a warning mid-month that temporarily interrupted the equity rally. The 30-year Treasury yield approached 5.2% in mid-May – its highest level since 2007, before the financial crisis – and the 10-year Treasury yield approached 4.7% (though bond yields did decline in the back half of May).

The main driver of higher yields was the Iran war’s inflationary impact on energy prices globally. The practical consequence for US households: 30-year fixed mortgage rates climbed back to 6.68%, putting further pressure on an already-stalled housing market.

Adding to the complexity, Kevin Warsh took over as Federal Reserve Chair on May 15, inheriting a divided institution with inflation running well above its 2% target.

The probability of a Fed rate hike in 2026, which was essentially zero a month ago, climbed as high as 45% during the month. Warsh’s first formal interest rate policy decision comes June 16.

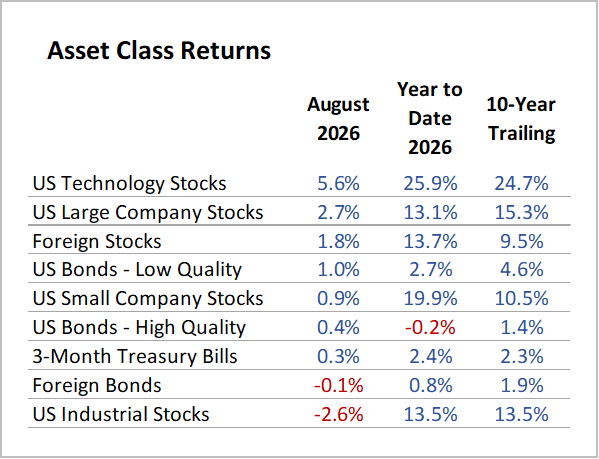
Despite the swings in yields, benchmark US bond indices delivered positive returns in May. High quality bonds returned 0.3% for the month, and low quality bonds rose 0.5%.

As June begins, the questions that defined May remain open. The Iran deal is unsigned. Inflation remains elevated. The new Fed chair faces his first policy decision with rate-hike odds that would have seemed unthinkable a few months ago.

And yet the stock market enters June at all-time highs, with US Large Company Stocks up 11.2% for the year and Foreign Stocks up 9.1%. Whether the optimism that has driven the fourth consecutive year of stock market gains (so far) proves durable is the central question for the months ahead.

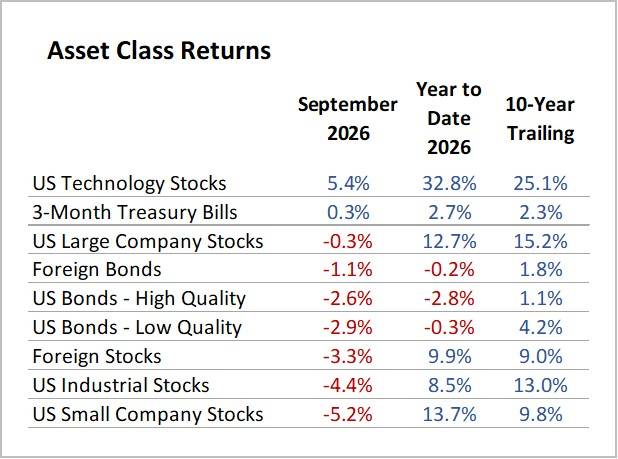
Here are results for May and 2026 Year-to-Date, compared to longer-term annualized returns (10-Year Trailing):

Note: YTD 2026 as of 5/31/2026; Source: Morningstar

-RK

April 2026 Market Recap: One Strong Month

April proved to be an exceptionally strong month for the stock market.

The month opened against the backdrop of an active shooting war, a nearly closed Strait of Hormuz, record oil prices, and a consumer confidence reading at an all-time low. Despite these concerns, stocks powered forward setting new all-time highs.

April was defined by three themes: diplomacy; an earnings season that delivered; and artificial intelligence producing revenue results for big technology companies.

The first theme was diplomacy — messy, uncertain, but seeming to trend in the right direction, from a financial markets standpoint.

April’s arc ran from President Trump threatening to knock out “every power plant and every bridge” in Iran, to a Pakistan-brokered ceasefire, to Iran briefly opening the Strait and then closing it again, to a revised Iranian proposal arriving through mediators on the final day of the month.

None of it was clean, and no permanent deal was reached. But markets are forward-looking, and as each week passed, the probability of catastrophic escalation fell while the probability of an eventual resolution rose. That directional shift — even without a final outcome — was enough to send stocks marching to new all-time highs.

The second theme was an earnings season that delivered, broadly and convincingly.

By month’s end, roughly 87% of S&P 500 companies that reported had beaten Wall Street analysts’ earnings estimates, with first-quarter profit growth tracking above 13% year-over-year.

A few of the standouts:

  • Intel posted the largest earnings surprise — as a percentage — ever recorded for a major index component, sending the stock up 23% in a single session
  • Caterpillar stock jumped 10% on a blowout quarter and raised full-year guidance
  • Apple closed the season with record iPhone and Services revenue, announcing a $100 billion stock buyback, and Q3 guidance more than double what analysts had expected

The message from corporate America was consistent and clear: revenue and profits are generally on an upward trend and business is resilient.

The third theme was artificial intelligence — not as a concept, but as a revenue reality.

Several of the largest technology companies in the world showed impressive financial results related to AI infrastructure: Google Cloud grew 63% year-over-year, Microsoft’s Azure accelerated to 40% growth, and Amazon Web Services posted its fastest growth rate in 15 quarters. These were not promises about future potential — they were current-quarter revenue numbers from businesses already running at tens of billions of dollars in annual revenue.

Here are results for April and 2026 Year-to-Date, compared to longer-term annualized returns (10-Year Trailing):

Note: YTD 2026 as of 4/30/2026; Source: Morningstar

March 2026 Market Recap: Resiliency, Tested

The war in Iran that began in late February continued throughout March. This put downward pressure on stock and bond prices, as investors worried about how long hostilities would last.

The main concern in March was the inflationary impact of significantly higher oil prices.

The price of oil rose between 50 – 65% in March (depending upon which benchmark oil price is referenced). Many Americans are now paying $4 per gallon of gas.

If the war shows no signs of letting up soon, investors’ concerns will shift to the broader impact on the economy, the likelihood of slower growth, the impending hit to company profits, and the possibility of recession.

We are not at an economic crossroads yet.

The US economy has proven resilient in the face of stress in the energy markets in the recent past.

For example, there was no recession in 2022 when oil prices spiked after war broke out in Ukraine. It’s reasonable to expect that this also will be the case in 2026.

Currently, most forecasters still expect the US economy to expand in 2026 (see the following article) and for company profits to rise.

But if hostilities extend well into the spring, US economic resiliency may be tested further, which would likely mean continued challenges for the financial markets.

The month of March closed with a positive tone with stocks rising 3% on the last day of the month as the US administration signaled its willingness to end the military campaign in Iran.

Investors need to keep in mind that the political and military situation is fluid and volatile; that stocks could decline significantly from today’s levels; and that developments in the Middle East will have a strong impact on the financial markets in the months ahead.

Here are results for March and 2026 Year-to-Date, compared to longer-term annualized returns (10-Year Trailing):

Note: YTD 2026 as of 3/31/2026; Source: Morningstar

February 2026 Market Recap: Foreign Markets Lead the Pack in February

The big market story for the year through February has been foreign stock market leadership. Foreign stocks almost matched their excellent January performance (4.9%) in February (4.6%). Currency was not a significant driver of dollar-based returns in either period.

In February, US large company stocks slipped, declining by 0.9%, compared to January’s positive return of 1.5%.

Within US equities, the rotation out of large company US technology stocks has shifted from January’s move into small company stocks to February’s preference for non-technology large company US stocks.

The bond markets continued to show positive results. Intermediate- and long-term Treasury bond yields declined over the course of February. The 10-Year Treasury bond yield actually fell below 4% for the first time in several months. The benchmark for US Investment Grade Bonds returned 1.6% in February.

Here are results for February and 2026 Year-to-Date, compared to longer-term annualized returns (10-Year Trailing):

Note: YTD 2026 as of 2/28/2026; Source: Morningstar

Market Update January 2026: AI Anxiety

For the past three years, developments related to Artificial Intelligence (AI) have captivated investors. Stocks of large technology companies associated with AI have done very well, and the biggest of the bunch have generally performed best.

Recently, however, stock market sentiment has shifted from AI excitement to AI anxiety.

The source of this anxiety is twofold, stemming from:

  1. Costs of Building AI: Developing AI infrastructure is costly; it will crimp the near-term profits of the companies building it; and it raises questions about profit margins for the AI infrastructure builders over the long term
  2. Results from Deploying AI: Expanded AI usage may be disruptive for jobs, companies, and the stock market

The Costs of Building AI

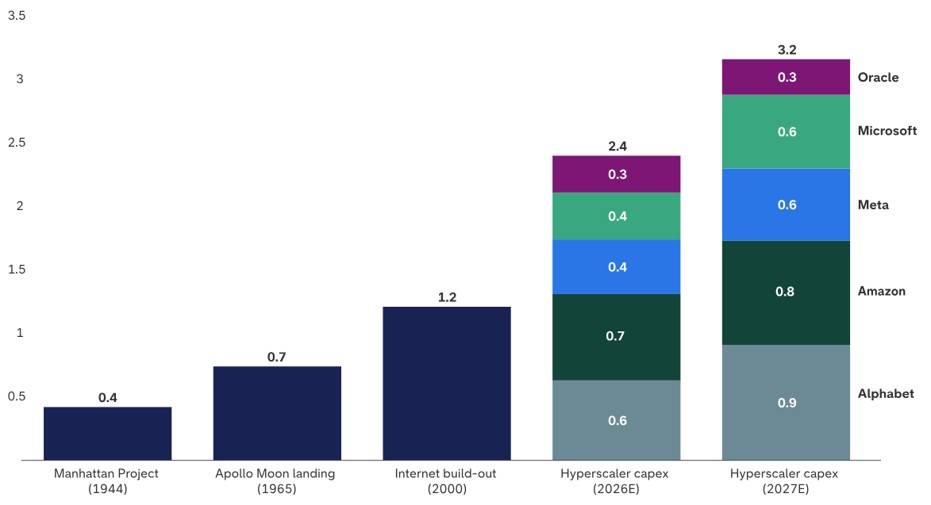
The term “hyperscalers” is being used to refer to the tech company giants that are building and operating massive cloud-based computing infrastructure that supports the training and deployment of Artificial Intelligence models.

In the United States, the hyperscalers are Alphabet (Google), Amazon, Meta Platforms (Facebook), Microsoft, and Oracle. Collectively, these five companies account for 17% of the S&P 500 index of large company US stocks.

In 2023, the year after ChatGPT emerged on the scene, hyperscalers’ capital expenditures (money spent for acquiring long-lived assets) was about $150 billion. In 2026, it’s expected to be about $650 billion.

For comparison, US federal government defense spending in 2026 is expected to come in at about $900 billion. And, $600 billion is about the size of the economies of Singapore and Sweden (measured by Gross Domestic Product, or GDP).

The sums being spent on AI infrastructure are enormous, and the acceleration of the spending is breathtaking. So, investors are questioning whether the capital commitments will be worth it.

Profitability has been high for the hyperscalers in recent years, but large-scale AI investment is expected to pull down profit margins in the near term. Investors understandably do not like seeing margins decline, even for companies with long-term track records of operational success.

Perhaps AI investment will pay off and returns will start trending higher next year and beyond. Or, perhaps the anticipated demand for the compute capacity will be less than expected, and profit margins will be lower for longer.

Here’s how hyperscaler stock prices have performed over the past three years, and so far in 2026, compared to the broad market for US large company stocks as represented by the S&P 500:

Note: YTD 2026 as of 2/20/2026; Source: Morningstar

The hyperscaler stock price stall is telling us that investors are less sure that today’s spending will translate to outsized profits in the future.

The Results from Deploying AI

It really is far too early to know what the effects of AI availability and AI usage will be.

But predictions affected stock prices in various areas of the market in the first part of February. Here are some examples:

  • AI developer Anthropic announced it was adding new legal tools to its Cowork assistant to help automate some legal drafting and research tasks. On February 3, shares of companies that provide legal tools and research databases dropped, as did other “software as a service” companies: Examples: Legalzoom dropped 20%; Thomson Reuters declined by 16%; Salesforce fell 7%.
  • OpenAI (maker of ChatGPT) said it was adding an app for homeowner insurance quotes. Shares of insurance brokers proceeded to decline. Example: Marsh & McLennan dropped 8% on February 9.
  • Financial custodian Altruist said its AI assistant could handle some tax-related tasks. Shares of brokers and financial custodians dropped. Example: Charles Schwab lost 7% on February 10.
  • A Florida-based firm said it could use AI to improve efficiency in the trucking business. Shares of airlines, railroads, and trucking firms slid. Example: C.H. Robinson shares lost 15% on February 12.
  • The CEO of Anthropic recently claimed that AI would wipe out half of all entry level white-collar jobs in the next one to five years, and Microsoft’s head of AI said that “most if not all” professional tasks would be automated within 18 months.

Some investors are inclined to shoot first before asking questions and seeing the results of AI deployment and utilization.

Other investors who hear about new technologies and see wild price swings in some stocks of established companies may be unsettled.

In his recent Weekly Commentary from February 17, professor and long-time market practitioner Jeremy Siegel offered these observations:

  • Technological change will continue to disrupt industries, and some business models will be impaired
  • Productivity growth is ultimately deflationary and wealth-enhancing
  • We may even see the long-discussed four-day workweek become viable over time as output per hour accelerates; that is not a recessionary signal, that is a prosperity signal
  • Anxiety is part of every technological transition
  • Today’s data tell us the economy is stabilizing, inflation is receding, and real incomes are rising
  • This is not a backdrop for derailing a bull market; it is a backdrop for its expansion

While it is worth having some perspective on what’s going on underneath the surface of a stock market, trying to pick winners and avoid losers as new technologies emerge is unadvisable.

A better, time-tested approach to investing is to maintain a diversified portfolio with exposure across sectors and markets, and to enjoy a rising tide that lifts many boats over the long term.

The financial markets got off to a satisfactory start for the first month of 2026. Here are results for January:

Source: Morningstar

December 2025 Market Recap: It’s a Wrap: 2025 Market Review

Often from Christmas through year end, investors are treated to a “Santa Claus Rally”, where stock prices rise. But 2025 followed the atypical pattern from 2024: stock prices fell during the final days of the year.

The waning-days-of-2025 drop marks the 13th time the benchmark S&P 500 index fell by more than 1% over that span since 1952.

As catalogued in our Review last year at this time, a “Santa Slump” does not necessarily foreshadow poor returns for the year ahead.

Bespoke Investment Group found that, in the twelve months following a year-end decline of more than 1%, stocks tended to do better. Large company stocks’ median performance after Santa Slum years, in fact, has been a gain of about 12%.

For 2025 as a whole, it was another strong year for U.S. stocks. In 2025, the S&P 500 index of large-company stocks rose nearly 18% and hit 39 new all-time highs along the way. This follows annual returns of 25% in 2024 and 26% in 2023.

Once again, the technology sector was a major contributor to these more-than-satisfactory gains. Tech was the top-performing sector in the S&P 500 during 2025, gaining nearly 25%.

Furthermore, the seven largest tech companies (Alphabet, Amazon, Apple, Meta, Microsoft, Nvidia, and Tesla), often referred to as the “Magnificent 7”, contributed about half of the S&P 500’s price return in 2025.

Outside of the US, stock returns were even more impressive. The MSCI EAFE (Europe, Australasia, and the Far East) index of foreign stocks rose by 31.6%.

One reason why foreign stock returns bested US stocks is that the US dollar fell by about 7.5% compared to other major foreign currencies. Dollar weakness boosts foreign stock returns, when those returns are measured in US dollars.

Even though bond returns lagged behind stock returns, bonds had a good year, too.

A key driver of the positive performance for bonds has been declining interest rates, which helped to push up bond prices. Over the course of 2025, 3-Month Treasury bill yields dropped by 0.7 percentage points, and 5-Year and 10-Year Treasury bond yields declined by 0.6 and 0.5 percentage points, respectively.

For 2025, high quality intermediate-term bonds, measured by the benchmark Bloomberg US Aggregate Bond Index, returned 7.2%For short-term bond funds, where prices are much less influenced by changes in interest rates, results were less impressive, with returns landing in the 4-6% range.

Here’s a snapshot of US stock and bond performance in 2025; the 5-year average annual return for each asset class is included for comparison purposes.

Source: Moore Financial Advisors & Morningstar

-RK

November 2025 Market Recap: Silver Lining Ahead

November started out looking like a month not to remember, as the government shutdown continued, concerns mounted about the Federal Reserve backing away from interest rate reductions, technology stocks sank, and crypto prices cratered.

By mid-month asset price declines were mounting: US large company stocks were down by 4%; technology stocks had fallen by 9%; and Bitcoin had dropped by 23%.

However, the mood in the market became more positive as the month lengthened, perhaps helped by a holiday hiatus and the arrival of year-ahead forecasting season.

Wall Street research departments are delivering their best guesses for what might happen in the next twelve months. And many forecasters look for another year of double-digit returns for stocks in 2026.

By the time November drew to a close, many asset classes had posted modestly positive returns.

Here’s a snapshot of financial market performance for the month of November and Year-to-Date (YTD):

Source: Moore Financial Advisors & Morningstar

October 2025 Market Recap: Another Month, Another Record

The stock market got fresh fuel during the last week of October in the form of positive earnings reports from large technology companies, which helped push stock indexes to a new all-time high.

Apple, Amazon, and Alphabet (Google) all posted revenues and profits that exceeded expectations and telegraphed solid outlooks for 2026. These three stocks combined make up 16% of the S&P 500 Index.

Thus far in 2025, the large company US stock index has closed at record levels on thirty six occasions – most recently on October 28.

The government shutdown, which persisted throughout the month and carried on into November, thus far seems to have had little impact on financial markets.

But the Federal Reserve’s decision to reduce interest rates has contributed to constructive market sentiment.

The Fed cut the Federal Funds Rate for the second time in 2025 on October 29, bringing the official target for short-term interest rates to a range of 3.75% – 4.0%.

Lower interest rates are generally viewed as supportive for stocks because when the Fed cuts rates, it often becomes less expensive for many companies to borrow money.

Cheaper loans can lead to increased investment in growth-related activities (like research, hiring, and expansion) which can boost company earnings in the future.

The Fed committee that determines interest rate policy meets again for the final time in 2025 next month.

Expectations are for another rate cut on December 10, which would bring the short-term interest rate target below 4% for the first time since 2022.

October was a positive month across the board for broad-based stock and bond market indexes, as the chart below shows.

Source: Moore Financial Advisors & Morningstar

And with ten months now behind us, 2025 is likely to be another strong year for financial market returns.

In fact, the last extended period of tough sledding for stocks happened more than three years ago. That bear market ended in October 2022, and stock returns have been stellar since then.

After three years of very strong returns, it’s natural to wonder: have stocks come too far, too fast? And, if so, is it time to sell risky stocks and move to the safety of cash before the tide turns and the next bear market arrives?

This type of inquiry centers around the idea of market timing: making buy or sell decisions based on predictions of future market movements.

If you can accurately predict what will happen tomorrow, making big moves with your money to “lock in gains” and “avoid losses” today is logical.

However, we’re unaware of anyone who can accurately and consistently predict what will happen in financial markets and to stock prices, especially over the near term.

Rather than trying to guess what will happen in financial markets tomorrow, or next week, or next month, taking a long-term approach to investing is a far better approach.

Building expectations for financial market returns, establishing asset allocation targets that support your financial plan, and ensuring that your portfolio reflects those targets are important elements of successful investing over the long term.

Attempting to “get ahead of the market” introduces the possibility of failing to capture future gains by not having enough stock market exposure, and falling short of the long-term returns required by your financial plan.

The well-regarded investor and author Peter Lynch has said: “Far more money has been lost by investors preparing for corrections, or trying to anticipate corrections, than has been lost in corrections.”

These words of investment wisdom are worth paying attention to, particularly during extended periods of strong stock market returns.

-RK

September 2025 Market Recap: Good Times, Continued

September delivered another month of positive returns for investors:

  • Russell 2000 Index of small company stocks returned 5.5%
  • MSCI EAFE Index of foreign stocks returned 4.8%
  • S&P 500 Index of large company US stocks returned 4.2%
  • Bloomberg Aggregate Bond Index, the benchmark for US bonds, rose by 1.3%

US stocks reached new highs eight more times in September, bringing the tally in 2025 to twenty-eight new “all-time highs” for large company US stocks.

When viewed through a broader lens of the quarter (last three months):

  • US small company stocks were the top performer, returning 10.5%
  • US large company stock returns of 7.3% edged out foreign stock returns of 6.2%
  • Bonds delivered a more muted return of 2.8%

Widening the aperture further still, the chart below shows US financial market returns by quarter for the last two years.

Source: MFA & Morningstar

Large company US stock returns are shown in black, US bond returns are shown in orange.

This picture illustrates a pleasing run of positive performance: only one quarter in the past eight has been negative for stocks, with quarterly average stock performance at 6%.

Bonds haven’t fared as well, but still the outcome still has been constructive for investors. With two quarters of negative returns and one of essentially zero return, quarterly bond performance has averaged 2%.

One of the questions at the front of mind for many investors is: will the positive trends persist?

Here’s some historical perspective: according to research from Jessica Rabe at DataTrek (an independent research firm), the odds are greater for returns to reach their high point for the year in the 4th quarter when the stock market is having a good year.

DataTrek looked at annual returns each year since 1980 and catalogued the month in which the stock market peaked each year.

The table below shows stock market peaks by month; percent of time since 1980 that the stock market peaked for the year in that month; and average annual return when stock market peaked in a given month.

Source: DataTrek

Here are two key take-aways from DataTrek’s research:

  • the S&P 500 has tended to reach its high point for the year in December when returns for the full year were strongly positive (this happened in 24 of the 45 years since 1980, or 53% of the time – bottom of the chart)
  • the stock market has tended to reach its high point for the year in January when returns for the full year were strongly negative (5 times in 45 years, or 11% of the time – bottom of the chart)

As of Friday, October 3, US stocks had returned 15% year-to-date.

Applying her research to today’s market environment, Rabe at DataTrek concludes: “based on historical seasonal returns over the last 45 years, the S&P has significantly higher odds of peaking in the final quarter of this year rather than in September.”

It’s important to recognize that past performance doesn’t guarantee future results. But we can use history as a guide and as a way of informing our thinking about how things may unfold in the future.

While we avoid using terms such as “with certainty” and “without doubt”, the current environment of economic expansion, strong company earnings, and a Federal Reserve predisposed to bring down short-term interest rates seems conducive to a continuation of positive financial market trends, both for stocks and bonds.

That said, one area of emerging weakness which we’re watching closely is the US labor market.

The chart below from JP Morgan Asset Management presents monthly jobs gains using data from the Bureau of Labor Statistics. It shows that job growth slowed meaningfully over the summer of 2025.

Source: JP Morgan Asset Management.

Monthly jobs gains had been inflated because of “pandemic catch up” in 2021 and 2022 but still averaged over 200,000 jobs per month in the last couple of years through spring 2025.

This trend moved down to an average of 29,000 new jobs per month this summer.

If the employment situation downshifts further into persistent net job losses (yet to be determined) this could put downward pressure on US economic growth and put the stock market “good times” at risk.

And a new source of uncertainly stems from the shutdown of the US federal government. More information on that situation in next week’s upcoming blog “Government Shutdown Briefing”.

-RK

July 2025 Market Recap: Somnolent Summer – So Far

During the summer of 2025, financial markets have been somnolent – so far.

In a typical month which has 21 trading days, the S&P 500 index of large company stocks registers a daily rise or fall that exceeds 1% on average four times (trading days).

This means that about 80% of the time, stock market movements are unremarkable.

Since the summer solstice through the end of July, there were only two days when stocks moved more than 1% – and both were in a positive direction.

In this period of calm, stocks have been trending up, and the S&P 500 reached a new all-time high on July 28.

Recently, stock prices have been supported by company earnings reports for the 2nd quarter of 2025, which have validated that corporate revenues and profitability are generally strong, and in many cases have exceeded Wall Street’s earnings estimates.

Somnolence “took a break” on August 1st, however, when the Bureau of Labor Statistics (BLS) released its monthly employment report showing significant weakness in the labor market – and stocks proceeded to drop by 1.5%.

Specifically, downward revisions to May and June showed that 253,000 fewer jobs were created in these two months than previously reported.

In July, a net 73,000 new jobs were added – well below a level of 100,000 or more new jobs added per month that is commonly viewed as a sign of a healthy, growing economy.

The BLS employment report followed an announcement on July 30 which showed that the overall rate of growth of the US economy had slowed during the first half of 2025.

The Commerce Department said the value of all goods and services produced across the economy, or gross domestic product (GDP) grew at an average annual rate of 1.2% in the first six months of this year, a step down from the 2.5% average pace in 2024.

The weaker labor market, and slower pace of economic activity, may be enough to convince the Federal Reserve to change its policy and reduce its target for short-term interest rates – commonly referred to as a “rate cutting cycle” – as we approach autumn and head into winter.

So, recent data releases and stock price movements seem to indicate that both the US economy and the financial markets are at an inflection point.

If the current economic expansion holds up, and if the Federal Reserve begins to reduce interest rates soon, the stock bull market could continue to charge forward.

But if consumer spending sours, if businesses retrench, and if the economy goes from expansion to contraction, it could mean tougher times for stocks – even if the Federal Reserve cuts interest rates.

JP Morgan Asset Management researchers looked at the relationship between Federal Reserve interest rate policy changes and stock market performance against the backdrop of economic expansions and recessions going back 40 years.

The research shows:

  • Stocks have done well when Fed rate cutting cycles have coincided with slower (but still positive) economic growth – large company US stocks climbed on average by 18% in the year following the first Fed interest rate cut of a new cycle
  • When rate cuts coincide with recessions, stocks have suffered – losing an average of 5% in the year following the first interest rate cut of a new cycle

The key takeaway: consumer and business activity, along with the direction of Fed interest rate policy, will strongly influence the path along which financial markets will travel in the months ahead.

For the month of July, US stocks delivered satisfactory returns. Technology stocks did particularly well, gaining 4.6% for the month.

Tech stock strength helped to boost US large company stock returns, which gained 2.3% for the month. Small company US stocks rose by 1.7%.

The US bond index return was slightly negative last month as longer-term bond yields edged up.

And some of the steam was taken out of foreign company stocks, which declined by 2.1% in dollar terms, due primarily to a stronger US dollar.

The US dollar snapped its 5-month losing streak versus major developed economy currencies and rose by an average of 3% in July.

The chart below shows financial market performance for the month of July and Year-to-Date (YTD).

Source: Moore Financial Advisors & Morningstar

-RK